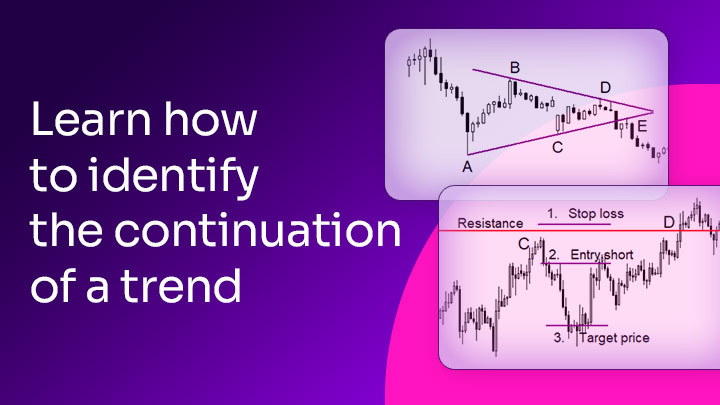
Continuation patterns and how to trade them
If you want to ride the trend confidently, you must learn how to spot continuation patterns on your chart. Lucky you! This article will help you with just that!
Continuation patterns indicate that the current trend is likely to continue, helping you make smarter trading decisions. Let’s break down how they work and how you can use them to your advantage.
What are continuation patterns?
In technical analysis and price action trading, patterns help traders anticipate the market’s next move. They come in two main types: candlestick patterns, which form over just a few candles, and chart patterns, which take shape over dozens of candles and provide a broader view of market structure.
If you’re looking for stronger market trend confirmation, chart patterns are the way to go. Since they take longer to form, they are less prone to false signals compared to candlestick patterns, making them more reliable for spotting trend continuations.
Just a reminder—chart patterns are just one piece of the puzzle when it comes to price action and technical analysis. They work best when combined with other tools. Think of it like gathering information: you wouldn’t rely on a single source, right? To improve your trading decisions, try pairing chart patterns with technical indicators like MACD, RSI, or moving averages.
We divide chart patterns into two major categories:
- Continuation patterns suggest that the market will keep moving in its current direction, even if the price temporarily pauses or pulls back.
- Reversal patterns signal the end of an existing trend and the start of a new one.
Each of these can also be classified as bullish or bearish patterns, depending on whether they indicate an upward or downward price move. For example, if a bearish reversal pattern appears in an uptrend, it suggests that the trend is running out of steam and the price may soon start falling.
Now, let’s dive into some of the most important continuation patterns that traders use to stay ahead of the market.
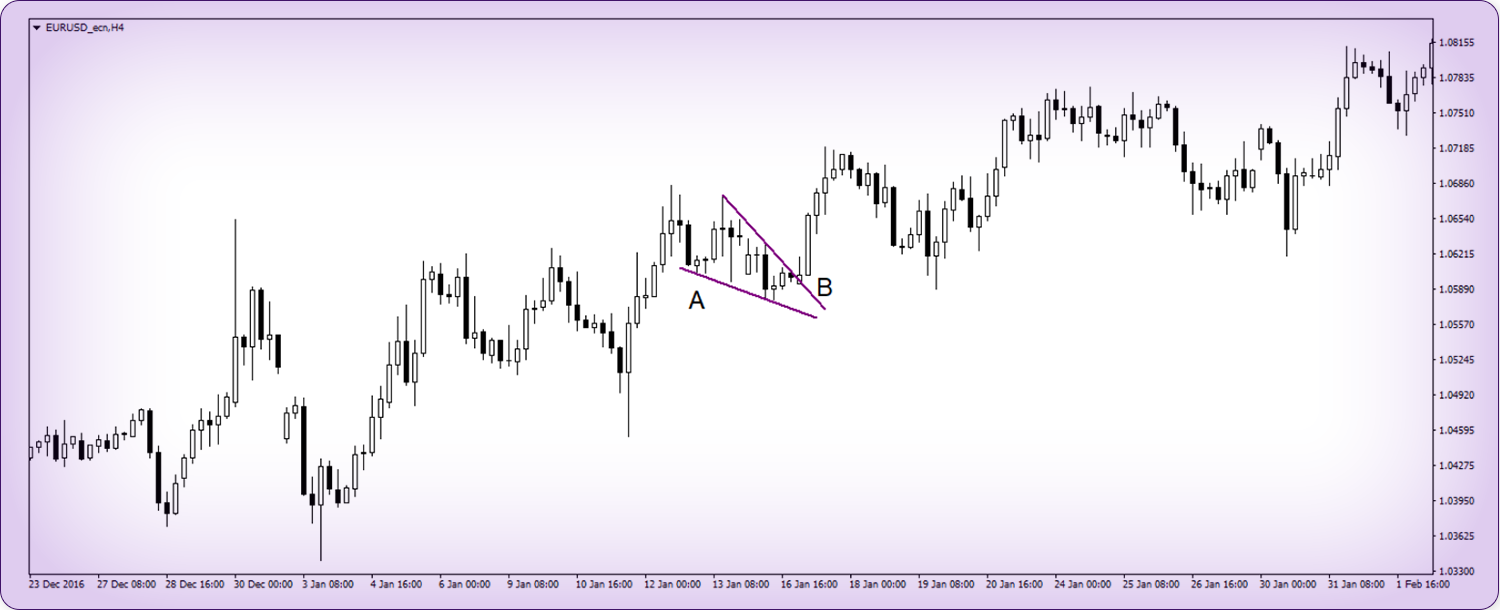
The pennant pattern
The pennant is a classic continuation pattern that appears after a strong trend move. It consists of two converging trend lines that form a small, symmetrical structure—just like a pennant on a flagpole. Unlike short-term candlestick setups, pennants take more time to develop, typically forming over 10 to 20 candles.
How to trade it:
A pennant signals trend continuation, but to confirm it, traders wait for a breakout. If the pattern forms in an uptrend, the entry comes when the price breaks above the pennant’s resistance. If it appears in a downtrend, traders wait for a break below the support.
Brotip: setting a stop loss is crucial. The safest approach is to place it at the lowest point of the pennant in an uptrend, or at the highest point in a downtrend.
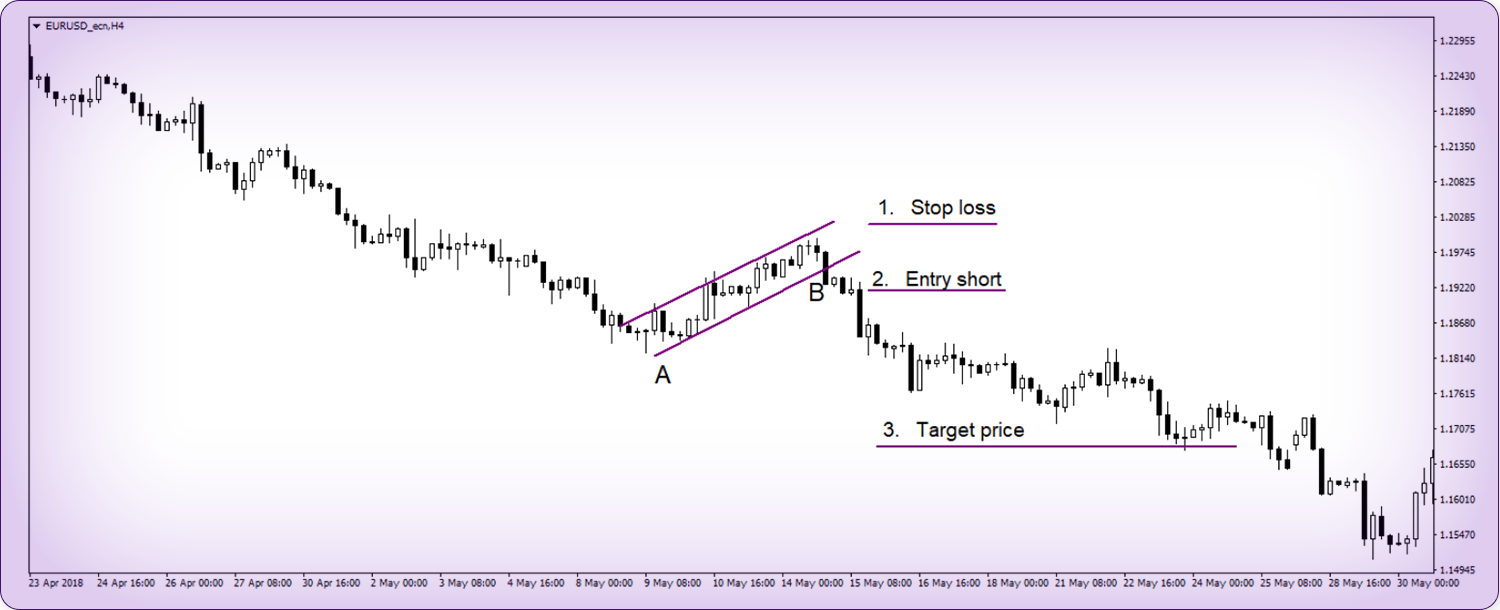
The flag pattern
Similar to the pennant, the flag is another key continuation pattern. The main difference is its shape: while the pennant converges, the flag forms two parallel trend lines, creating a rectangular consolidation area. This structure represents a temporary pause before the trend resumes its previous direction.
How to trade it:
The flag confirms its continuation role once the price breaks out of the formation. If the flag appears in an uptrend, traders look for a breakout above the upper boundary to enter a long position. If it forms in a downtrend, a breakout below the lower boundary signals a short entry.
The stop loss placement follows the same logic as the pennant. In an uptrend, it goes below the lowest point of the flag, while in a downtrend, it’s placed above the highest point.
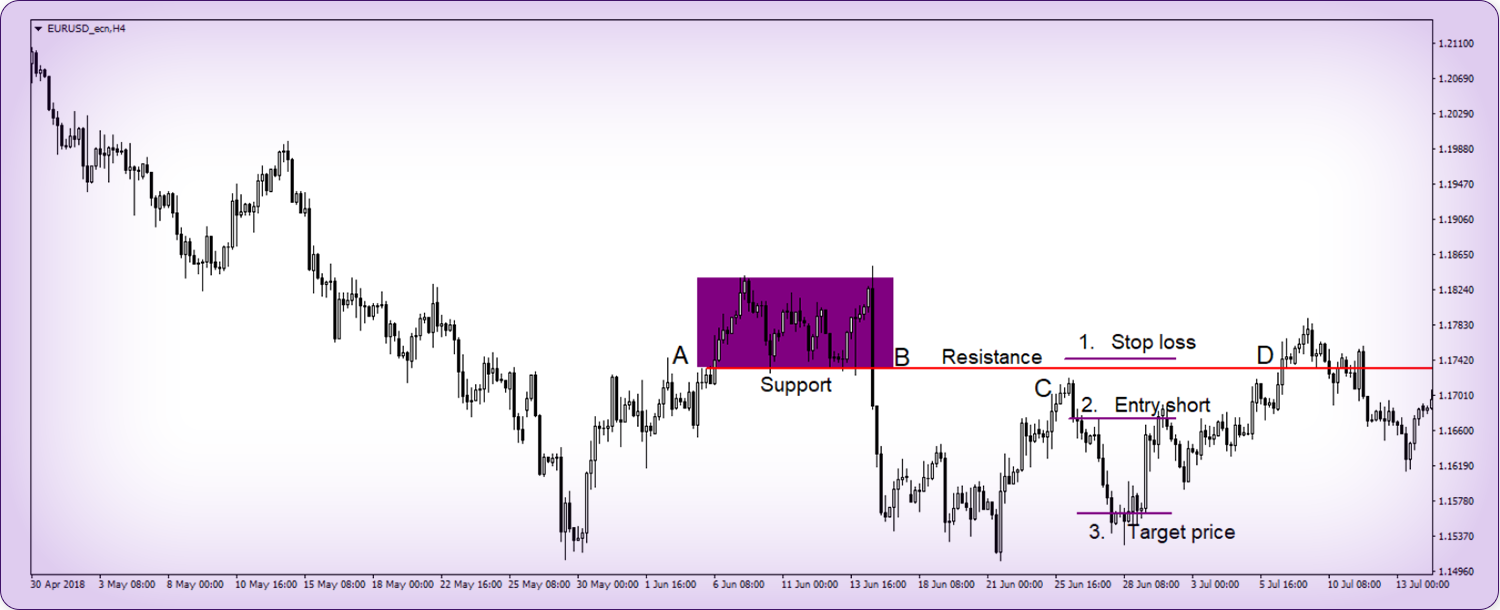
The Rectangle Pattern
The rectangle is a unique continuation pattern that occurs when the price moves sideways for an extended period, creating a clearly defined support and resistance zone. It can last for weeks or even months, tricking many traders into thinking the market is directionless—until a breakout happens.
To identify a rectangle pattern, look for at least two highs and two lows forming at nearly identical levels. These should align horizontally, creating a box-like structure.
How to trade it:
The key to trading rectangles is patience. Rather than entering too early, traders wait for a decisive breakout. Once the price moves beyond the upper boundary (in an uptrend) or the lower boundary (in a downtrend), it often retests the breakout level before continuing its move.
A useful rule of thumb for setting take profit is to measure the height of the rectangle and project it from the breakout point. This helps estimate the potential price move after confirmation.
However, one common challenge with rectangles is false breakouts. Sometimes, the price briefly breaks a level only to snap back inside, causing premature stop-outs. This is why proper risk management is essential.
The Triangle Pattern
Triangles resemble pennants in their structure, as they are formed by two converging trend lines. However, unlike pennants, triangle patterns take longer to develop—sometimes even months. They are commonly found across all timeframes, from short-term intraday charts to long-term market cycles.
There are three types of triangle patterns:
- Symmetrical triangle: Both trend lines slope toward each other at roughly equal angles. The price moves within the triangle until it eventually breaks out, usually in the direction of the main trend.
- Descending triangle: The upper trendline is sloping downward, while the lower trendline remains flat. This pattern usually signals a continuation of the downtrend.
- Ascending triangle: The lower trendline is rising, while the upper trendline is flat. This suggests that buyers are gaining control, increasing the likelihood of an upward breakout.
How to trade triangles:
A breakout from the triangle provides the entry signal. In a downtrend, traders wait for price to break below the lower boundary before shorting. In an uptrend, they look for a break above the upper boundary before going long.
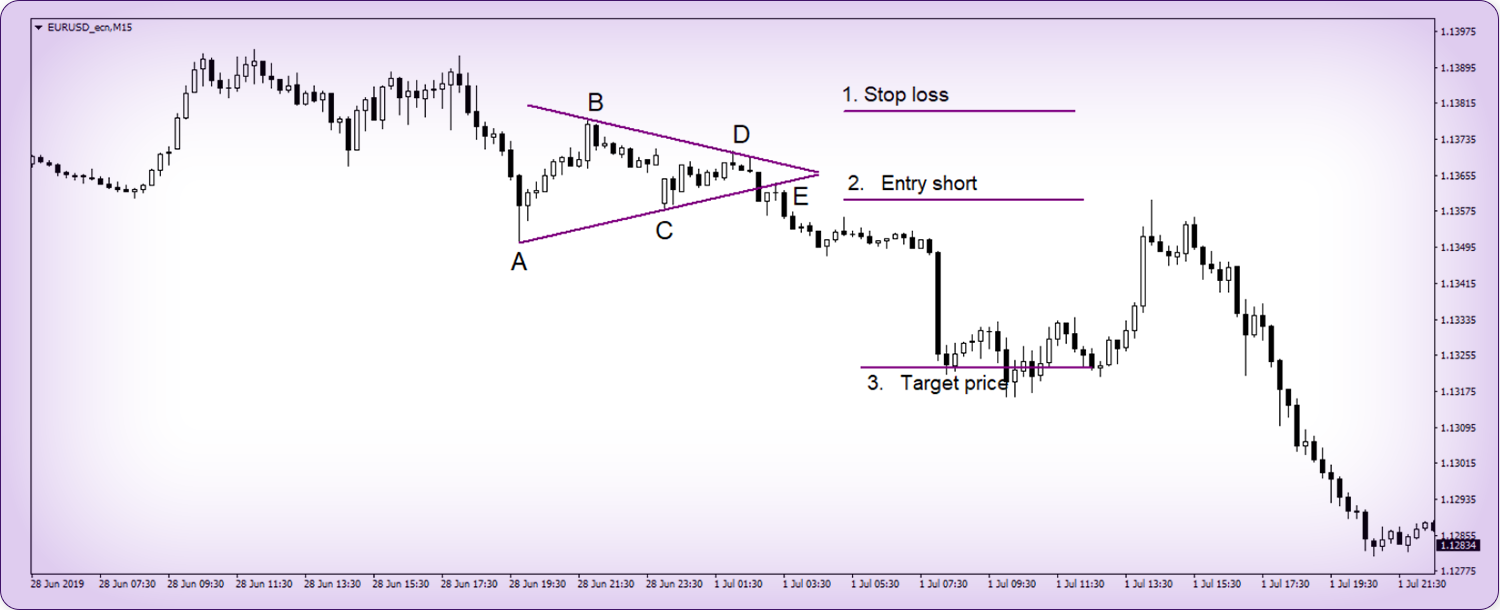
For example, a symmetrical triangle in a downtrend on the 15-minute chart might present a perfect short opportunity once the price breaks through support. Many traders use a risk-reward ratio (RRR) of 2:1 to maximize profitability while keeping risk under control.