Technical analysis patterns to help you pass the challenge
Technical analysis trading helps you quickly understand the market and jump into the game. Technical patterns can reveal potential price movements, giving you an edge. In this article, we’ll show you how to recognize key technical analysis patterns that can help you improve your trading strategy.

What is technical analysis?
Technical analysis is one of the most popular forex trading techniques used by traders worldwide. It focuses on price charts and trading volumes, avoiding fundamental data like news and economic reports. Instead, it relies on repeating patterns and trends in historical price movements.
Trading has been around for over 100 years, and traders have noticed that certain technical analysis patterns appear repeatedly. If you learn how to identify these patterns, you can better predict price movements and make informed trading decisions.
Fintokei tip ✅
One of the key aspects of trading technical analysis is trend identification. If you’re a beginner, it’s best to trade in the direction of the trend. Does technical analysis work? Not 100%. Just like anything in trading, it only increases your probability of success. The best approach is to combine technical patterns with indicators like MACD, RSI, or Bollinger Bands to maximize accuracy.
What are technical analysis patterns?
Also known as technical patterns, they fall into two main categories:
- Candlestick patterns – Formed by one or a few candlesticks, providing quick insights into market sentiment.
- Chart patterns (or price patterns) – Made up of multiple candlesticks and indicate longer-term market movements.
Chart patterns can be classified into:
Reversal patterns – Indicate a potential trend reversal.
Continuation patterns – Confirm that the current trend is likely to continue.
We’ve already covered many technical analysis patterns on our blog, but there are still more to explore! In this article, we’ll introduce you to patterns that didn’t make it into other articles—patterns that can help you pass your Fintokei challenge!
These technical analysis patterns can help you to pass the challenge
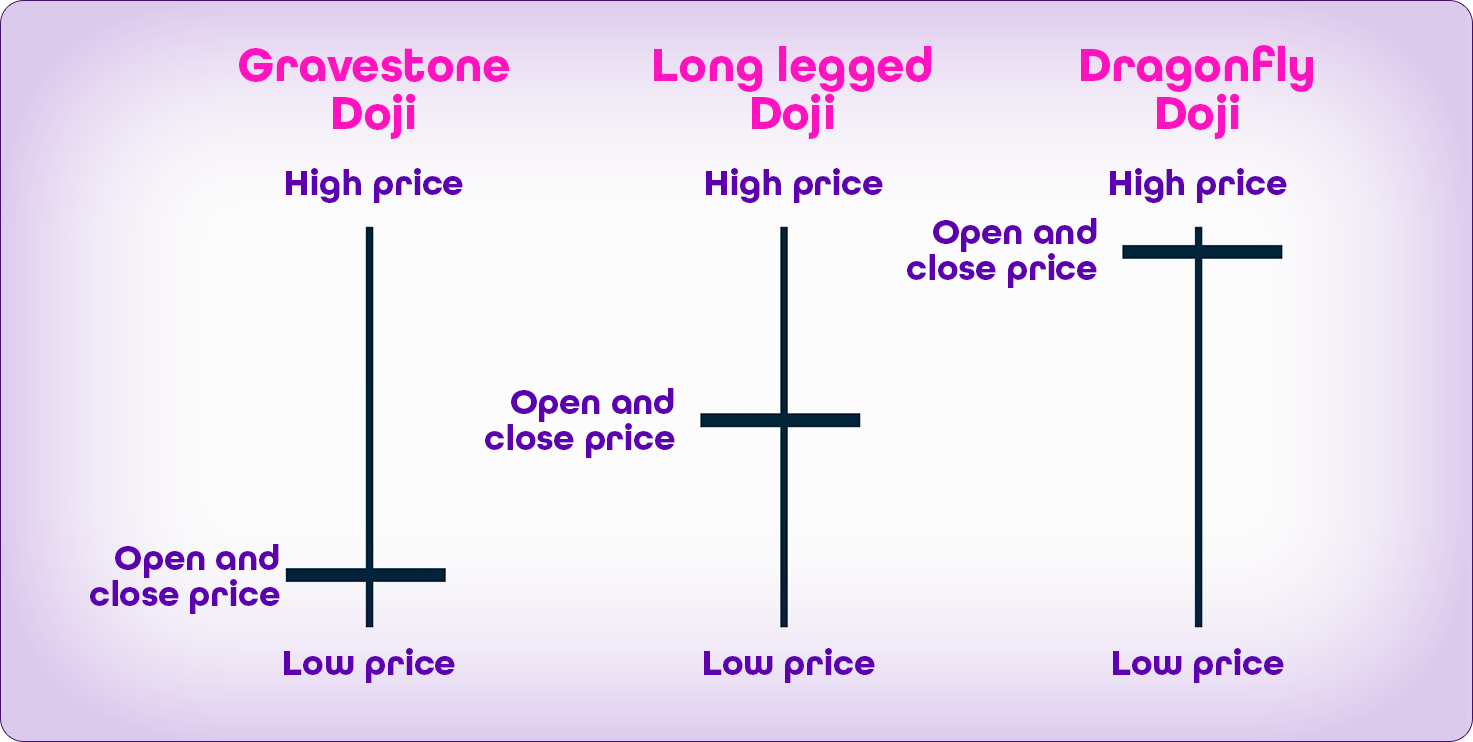
Doji candlestick – a sign of market indecision
The Doji candlestick forms when the market is in balance—neither buyers nor sellers have the upper hand. The name comes from Japanese, meaning “the same,” as the opening and closing prices are nearly identical.
There are several variations of Doji:
- Dragonfly Doji is a bullish reversal signal that appears when sellers push prices lower but buyers regain control by the close. It often forms at the bottom of a downtrend.
- Gravestone Doji is its bearish counterpart, signaling that buyers attempted to push prices higher but were ultimately overpowered by sellers. This pattern frequently appears at the top of an uptrend.
- Long-Legged Doji, with extended wicks on both sides, reflects extreme indecision and can lead to either a reversal or consolidation, depending on the broader market context.
Cup and handle
This bullish continuation pattern resembles a tea cup, with a rounded bottom followed by a small downward drift (the handle). It suggests a pause in an uptrend before a strong breakout.
How to trade it:
Traders typically enter after the resistance level is broken, but patience is key. Often, the price returns to retest the breakout point before continuing its move. Jumping in too early can result in unnecessary drawdowns. A logical stop loss placement is just below the lowest point of the handle, ensuring you’re protected if the pattern fails.

Ascending triangle
A powerful bullish setup, the ascending triangle forms when the price repeatedly tests a resistance level while printing higher lows. This suggests that buyers are gaining strength, and once resistance breaks, an explosive move to the upside often follows.
How to trade it:
For the best results, wait for a confirmed breakout rather than assuming it will happen. Some traders prefer to enter immediately after the breakout, while others wait for a pullback to the broken resistance, now acting as support. Either way, stop loss placement is crucial—typically below the last swing low or beneath the ascending trendline.

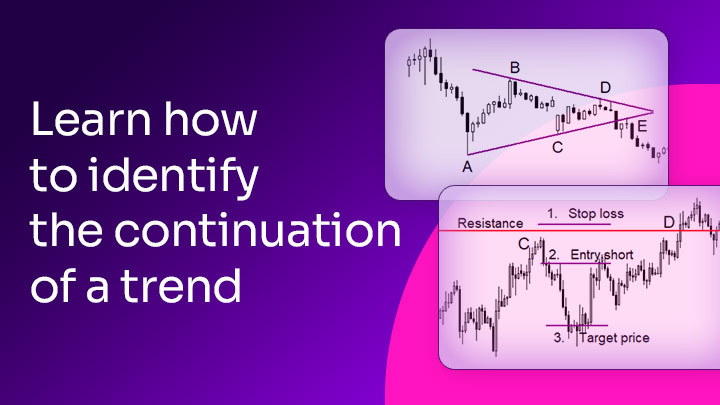
Descending triangle
The descending triangle is the bearish version of its ascending counterpart. Instead of forming higher lows, price action makes lower highs while repeatedly testing a support level. Sellers gradually take control, and once the support breaks, selling pressure intensifies.
How to trade it:
Many traders enter a short position upon the breakdown of support, though waiting for a retest can provide extra confirmation. Stop loss placement is usually just above the last swing high or the descending trendline, minimizing risk in case of a false breakout.