How to correctly identify a market trend
Accurate trend identification is one of the basic skills of any successful trader. In this article, we will show you what types of trends exist and what theory is most commonly used to identify them.

To trade profitably, mastering the art of recognizing trends in charts is essential. Simply put, the trend is a trader’s best ally. Trading in the direction of the trend significantly boosts the chances of making a profit. While it’s possible to trade against the trend, beginners should steer clear of this approach. Embrace the trend, and you’ll find yourself on a much smoother path to success.
There are 3 basic price movements
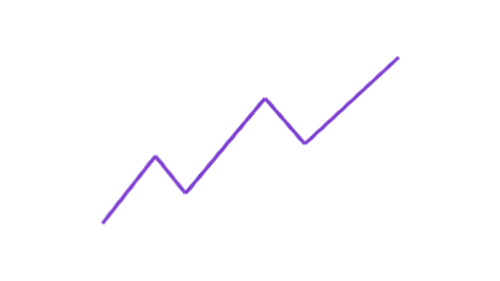
- Market growth, the so-called uptrend. A rising market is called a bull market.
- A falling market, called a downtrend. A falling market is called a bear market.
- A sideways direction, called a range or chop.
There are also 4 market states

Sideways movement (calm)
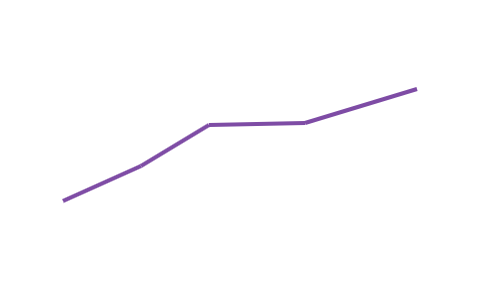
Calm trend
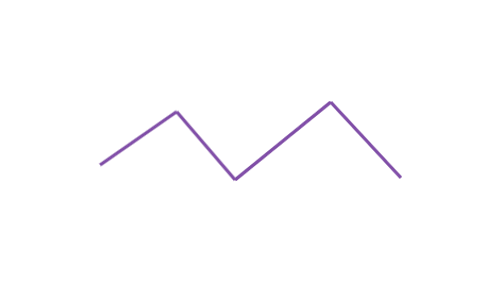
Sideways movement (volatile)
Volatile trend
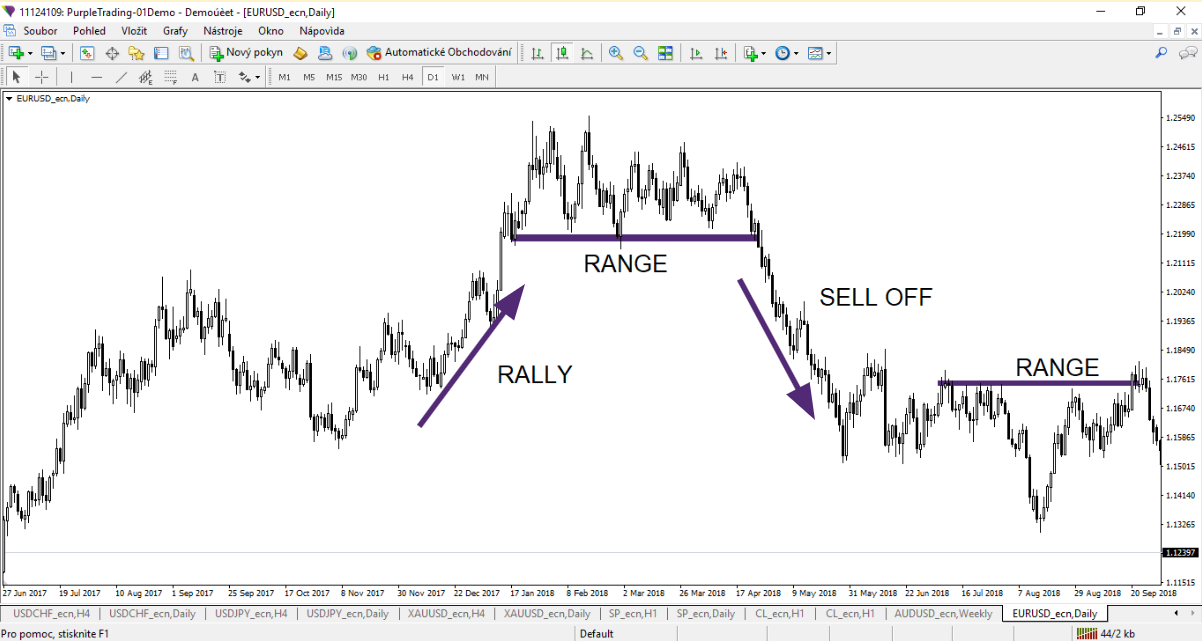
Traders have specific terms for different types of market movements. A sharp upward trend is known as a rally, while a steep decline is called a sell-off. You might already be familiar with these terms, but just in case: when you speculate on a price increase, you go long; when you anticipate a price drop, you go short. The chart below illustrates these concepts in action.
How to Identify a Trend Using Dow Theory
Identifying a trend can be done in several ways, but let’s focus on the most popular method: traditional technical analysis using Dow Theory. According to this theory, an uptrend is characterized by higher highs and higher lows. Conversely, a downtrend features lower lows and lower highs.
To confirm a new uptrend on your chart, look for at least one higher high and one higher low. For a downtrend, identify one lower low and one lower high. This approach provides a clear framework for recognizing market trends and making informed trading decisions.
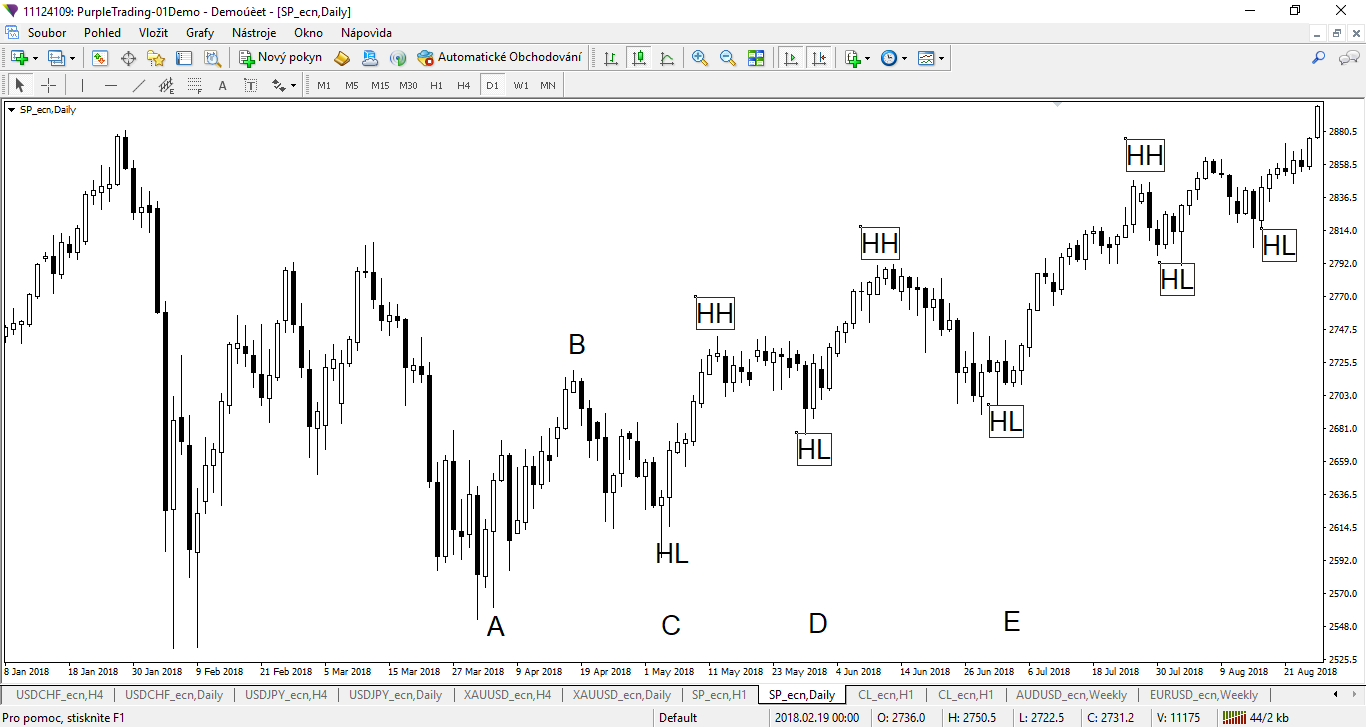
In the chart above, you can observe that the S&P 500 index made a higher low compared to the previous low at point A. This was followed by a higher high, surpassing the original high at point B. At point D, the price continued in the same direction, confirming the emergence of an uptrend. This would be an ideal time to open a long position, even in a swing manner, holding the position overnight or for several days.
So, we have identified an uptrend. But what about a downtrend? Let’s take a look at the next chart.
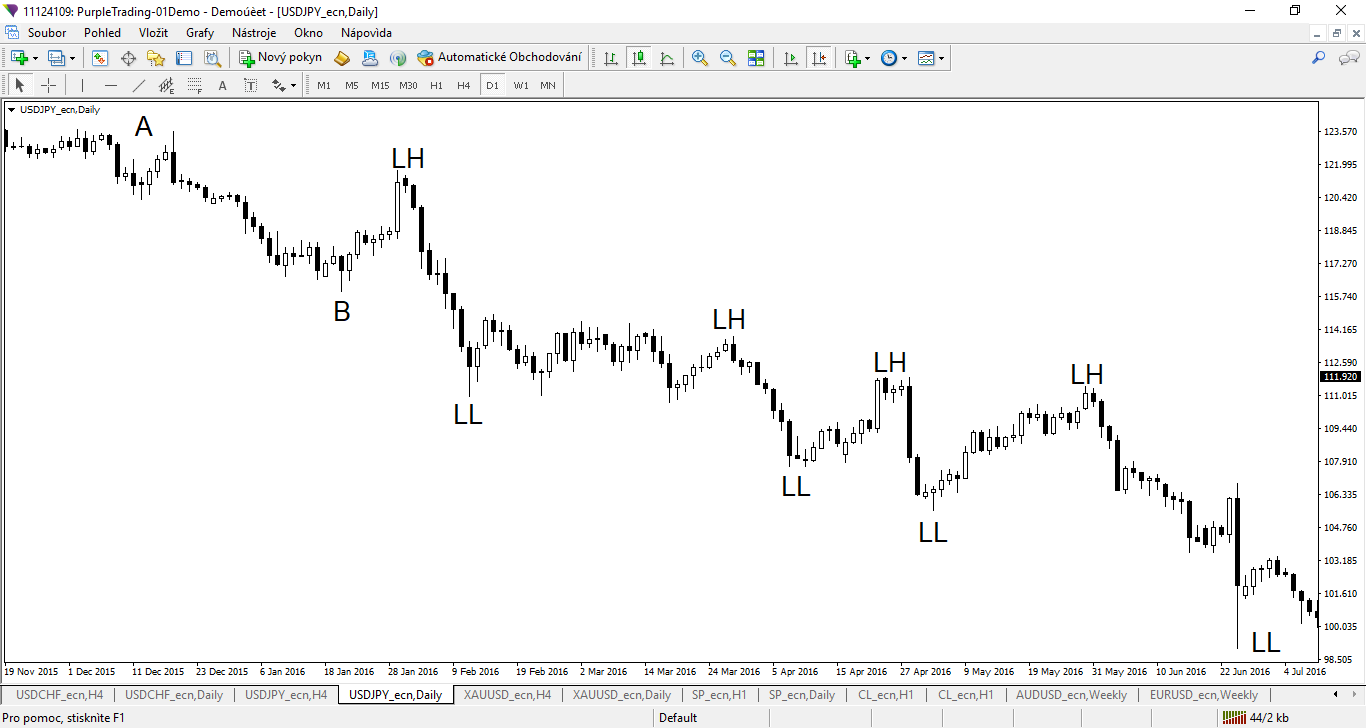
On this chart you can notice that point B was followed by a lower high than point A. This was followed by a lower low and then a sequence of lower highs and lower lows.
Why Do Lower/Higher Highs and Lows Occur?
The market is a constant battle between sellers and buyers. If the price is rising, it means buyers have the upper hand; if it is falling, sellers are in control. Keep this dynamic in mind when following trends.
In an uptrend, higher highs occur as buyers consistently drive the price up, while higher lows form as buyers step in earlier during minor pullbacks. This shows increasing confidence among buyers.
Conversely, in a downtrend, lower lows happen because sellers push the price down, and lower highs form as sellers enter the market sooner during brief price increases. This reflects the growing dominance of sellers over buyers.