Level Up your game with reversal chart patterns
Want to predict when the market's about to do a U-turn? Reversal patterns can help you spot just that! In this article, we'll dive into some of the most notorious ones to help you stay ahead of the curve.
There’s no better feeling in trading than riding a market trend from start to finish. The thrill of seeing the market move your way and your open position’s profit ramp up is priceless. But to experience that, you first need to master spotting trend reversal patterns. There are many ways to do this, and reversal patterns trading is one of the simplest. So, let’s get started!
What are reversal chart patterns?
Reversal chart patterns are a key part of technical analysis. As the name suggests, these candlestick reversal patterns or price formations often signal that the price might soon reverse and head in the opposite direction. You’ll usually find these forex reversal patterns forming at the peak (or bottom) of a market trend.
Fintokei tip:
The higher the timeframe you spot them on, the longer the reversal might last. But don’t just rely on one reversal pattern – always confirm your analysis with technical indicators (like MACD, Fibonacci), support/resistance zones, or trend lines. Keeping an eye on the economic calendar for major news is also crucial.
Depending on the direction, we divide these patterns into bearish reversal patterns and bullish reversal patterns.
Bearish reversal patterns
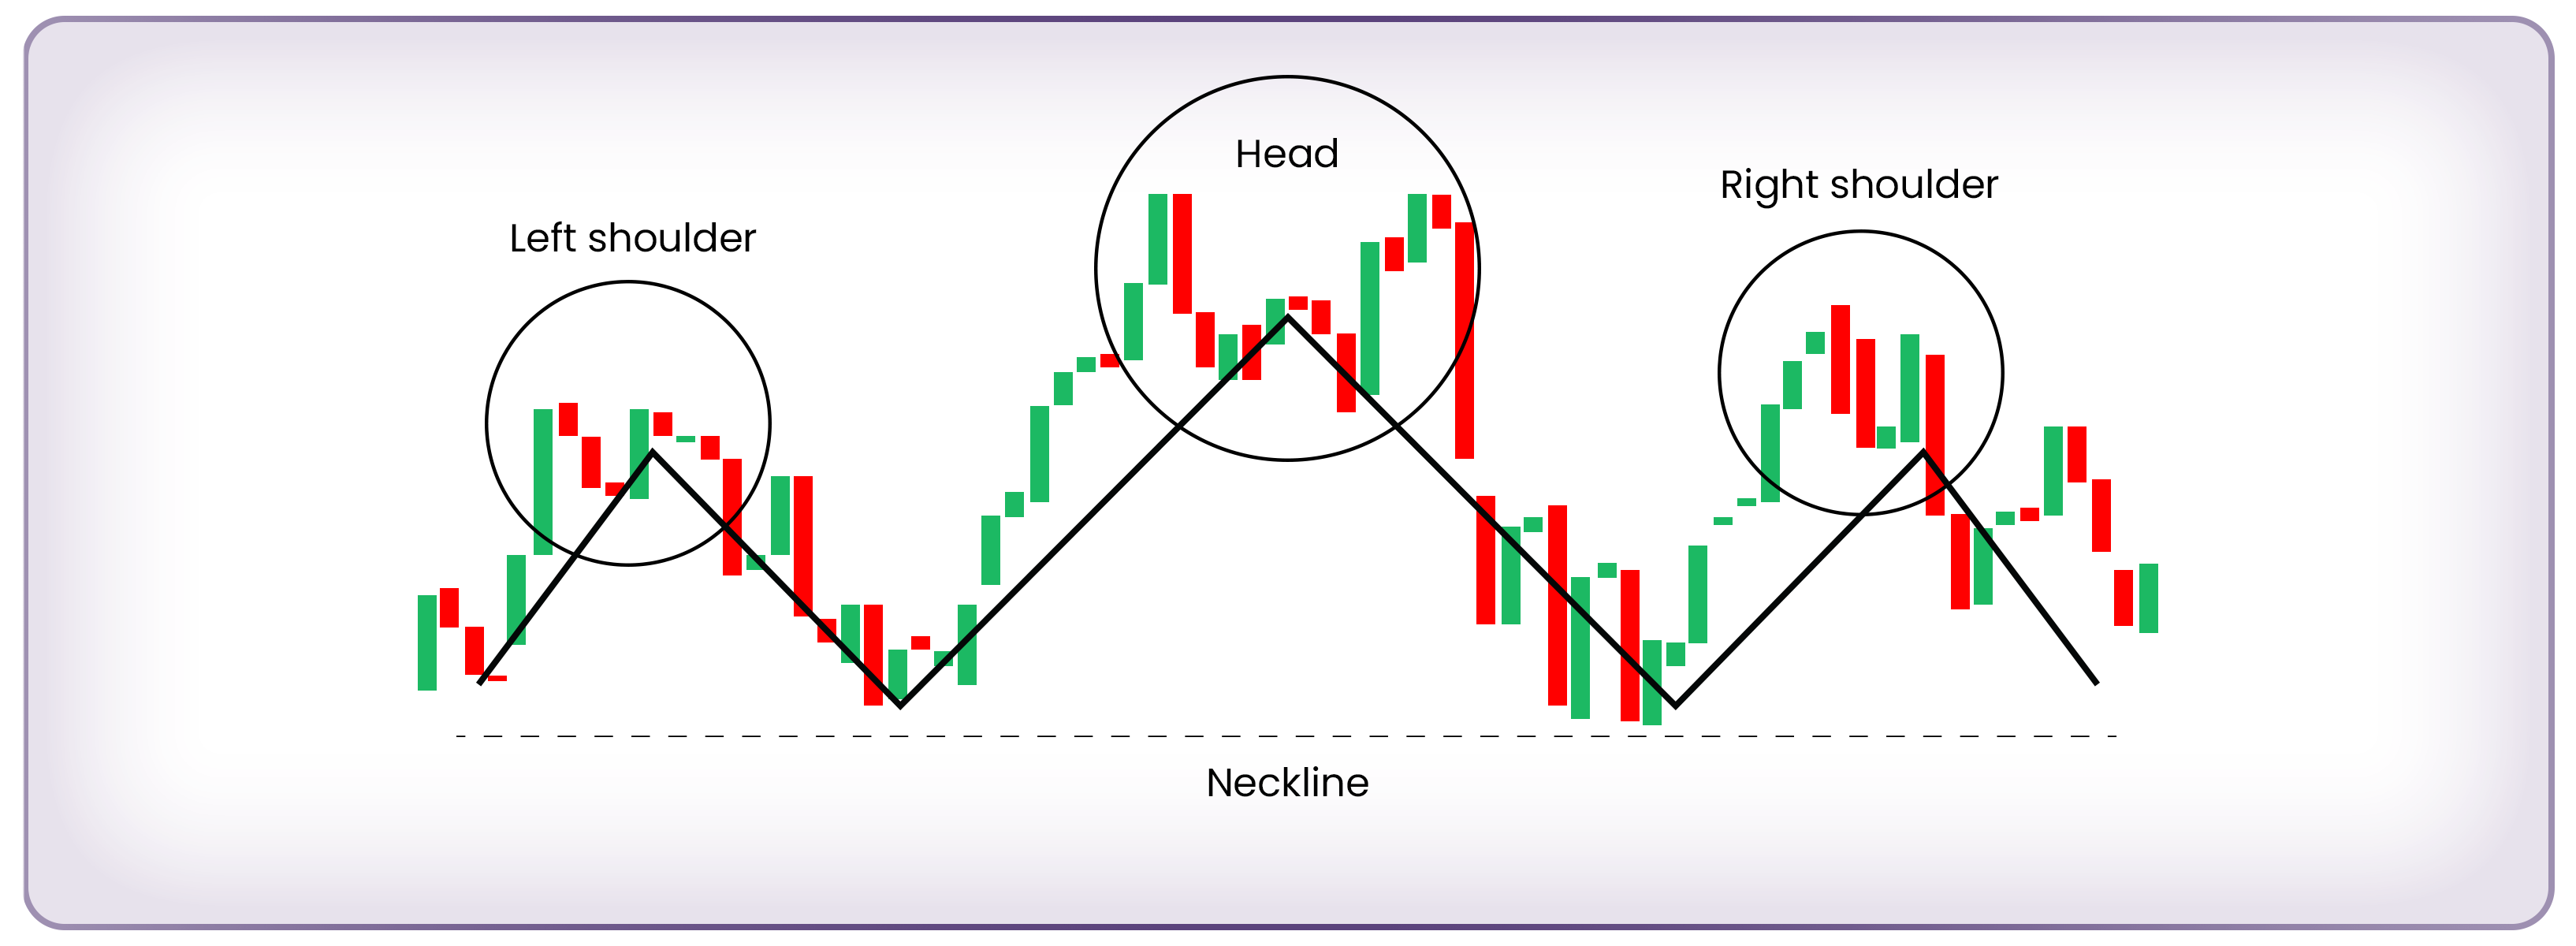
Head and shoulders reversal pattern
This classic bearish reversal pattern shows up at the peak of a rising trend. It consists of three peaks: the highest peak (the head) in the middle, flanked by two lower peaks (the shoulders). To spot this reversal pattern, connect the support levels of the shoulders to form the “neckline.”
- When to Enter: Wait for the price to break below the neckline before entering a short position. To avoid false breakouts, you can wait for the price to also break the local low formed after the neckline break.
- Why It Works: This pattern signals a shift in market sentiment. Buyers are running out of steam, failing to push prices higher on the right shoulder. Once the neckline is broken, it’s a strong sign that the trend is reversing from bullish to bearish.
- Risk Management: Always keep your drawdown levels in check, especially when trading with Fintokei. Place your stop loss just above the second shoulder’s peak.
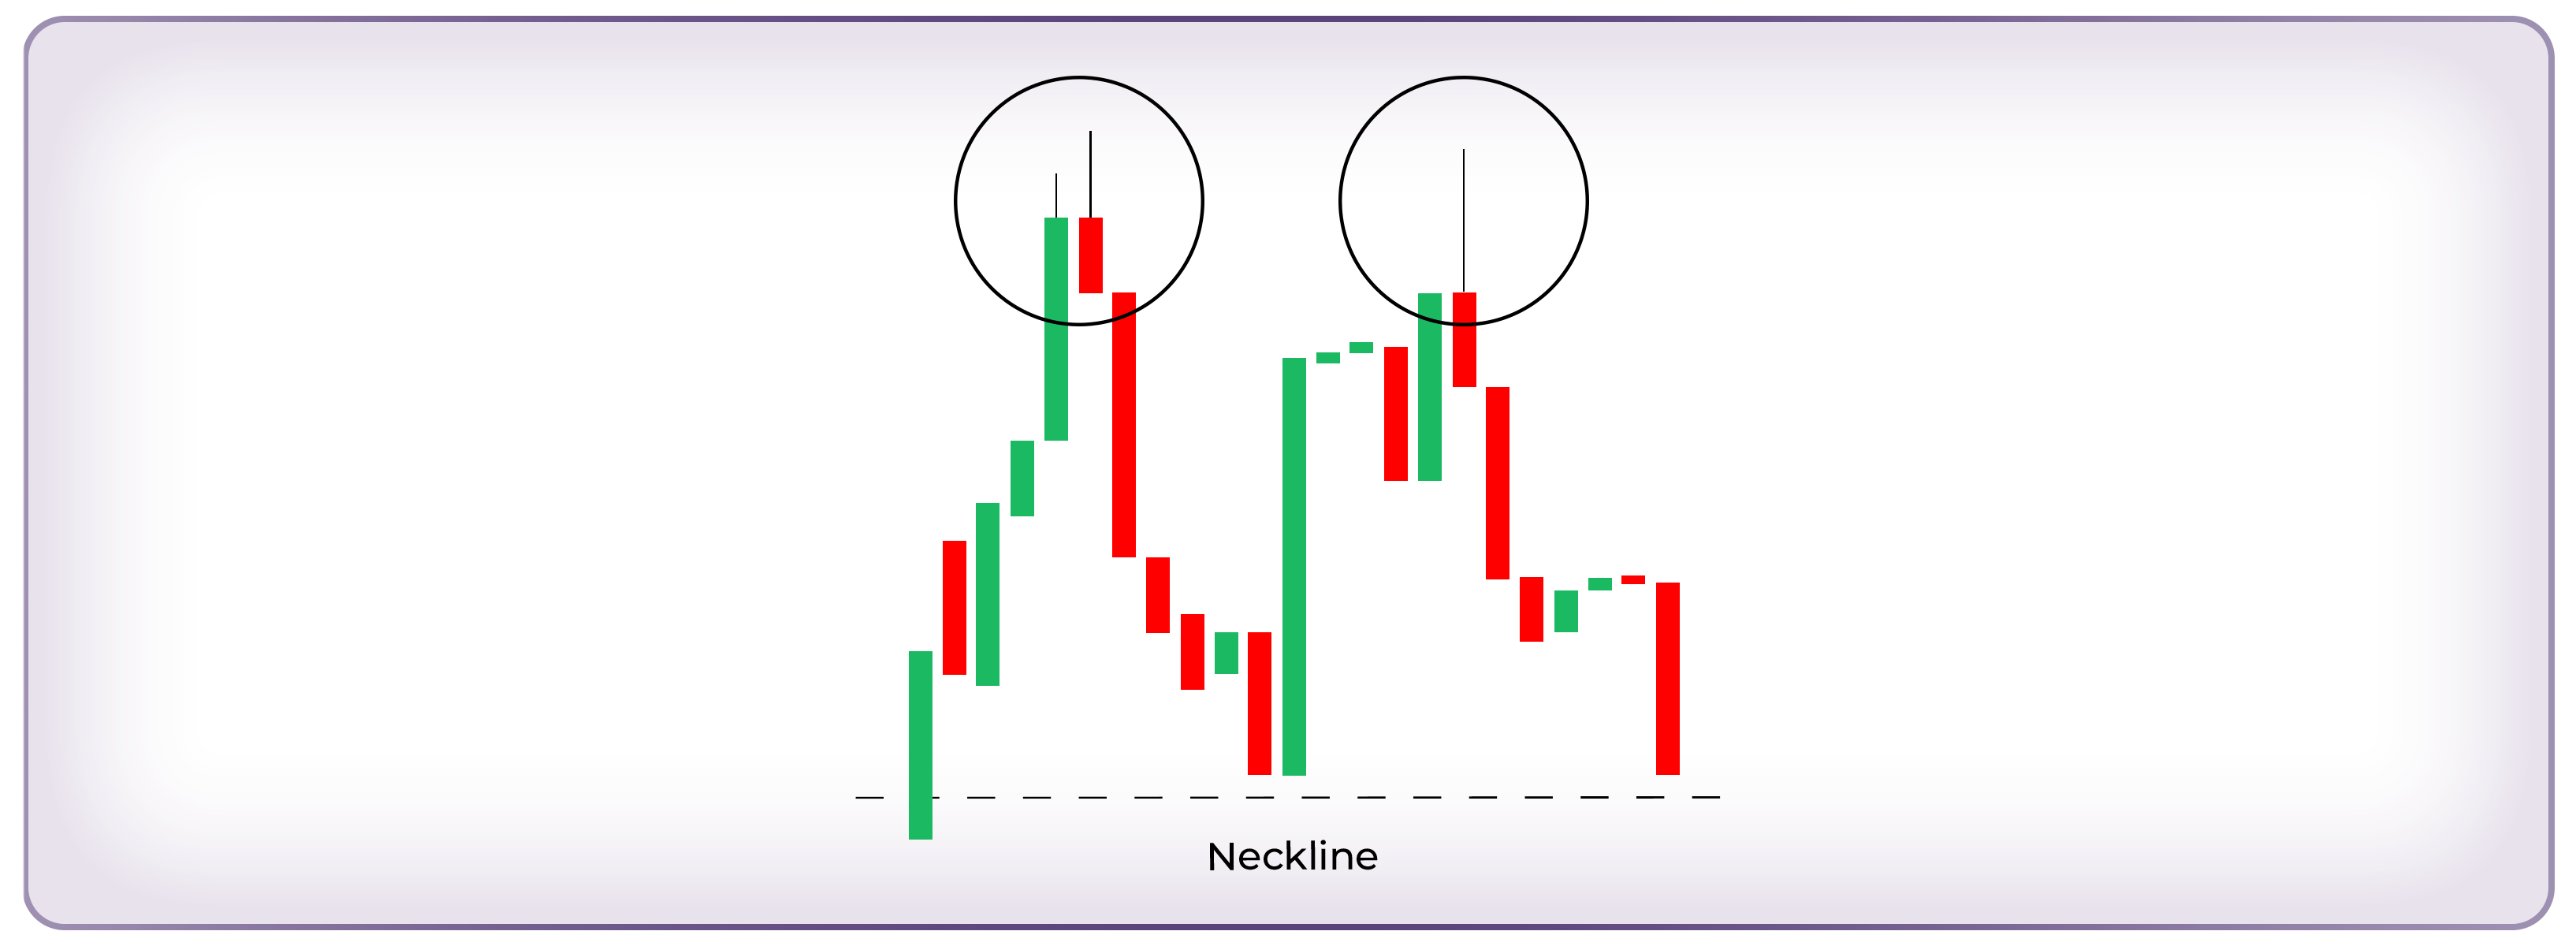
Double top reversal pattern
The double top reversal pattern forms when the market tests the same resistance level twice but fails to break higher. This suggests that buyers are losing strength, and a reversal is on the horizon.
- When to Enter: Just like with the head and shoulders, wait for a neckline breakout to confirm the reversal.
- Why It Works: Bulls push the price up twice but fail to break the resistance, showing that sellers are gaining control.
- Risk Management: Place your stop loss just above the two peaks. For take profit, use the same distance as your stop loss but in the opposite direction.
Bullish reversal patterns
These trend reversal patterns tells a story of gradually weakening bears. As sellers run out of steam, buyers take the wheel and run the price up. Changing the trend in the process.
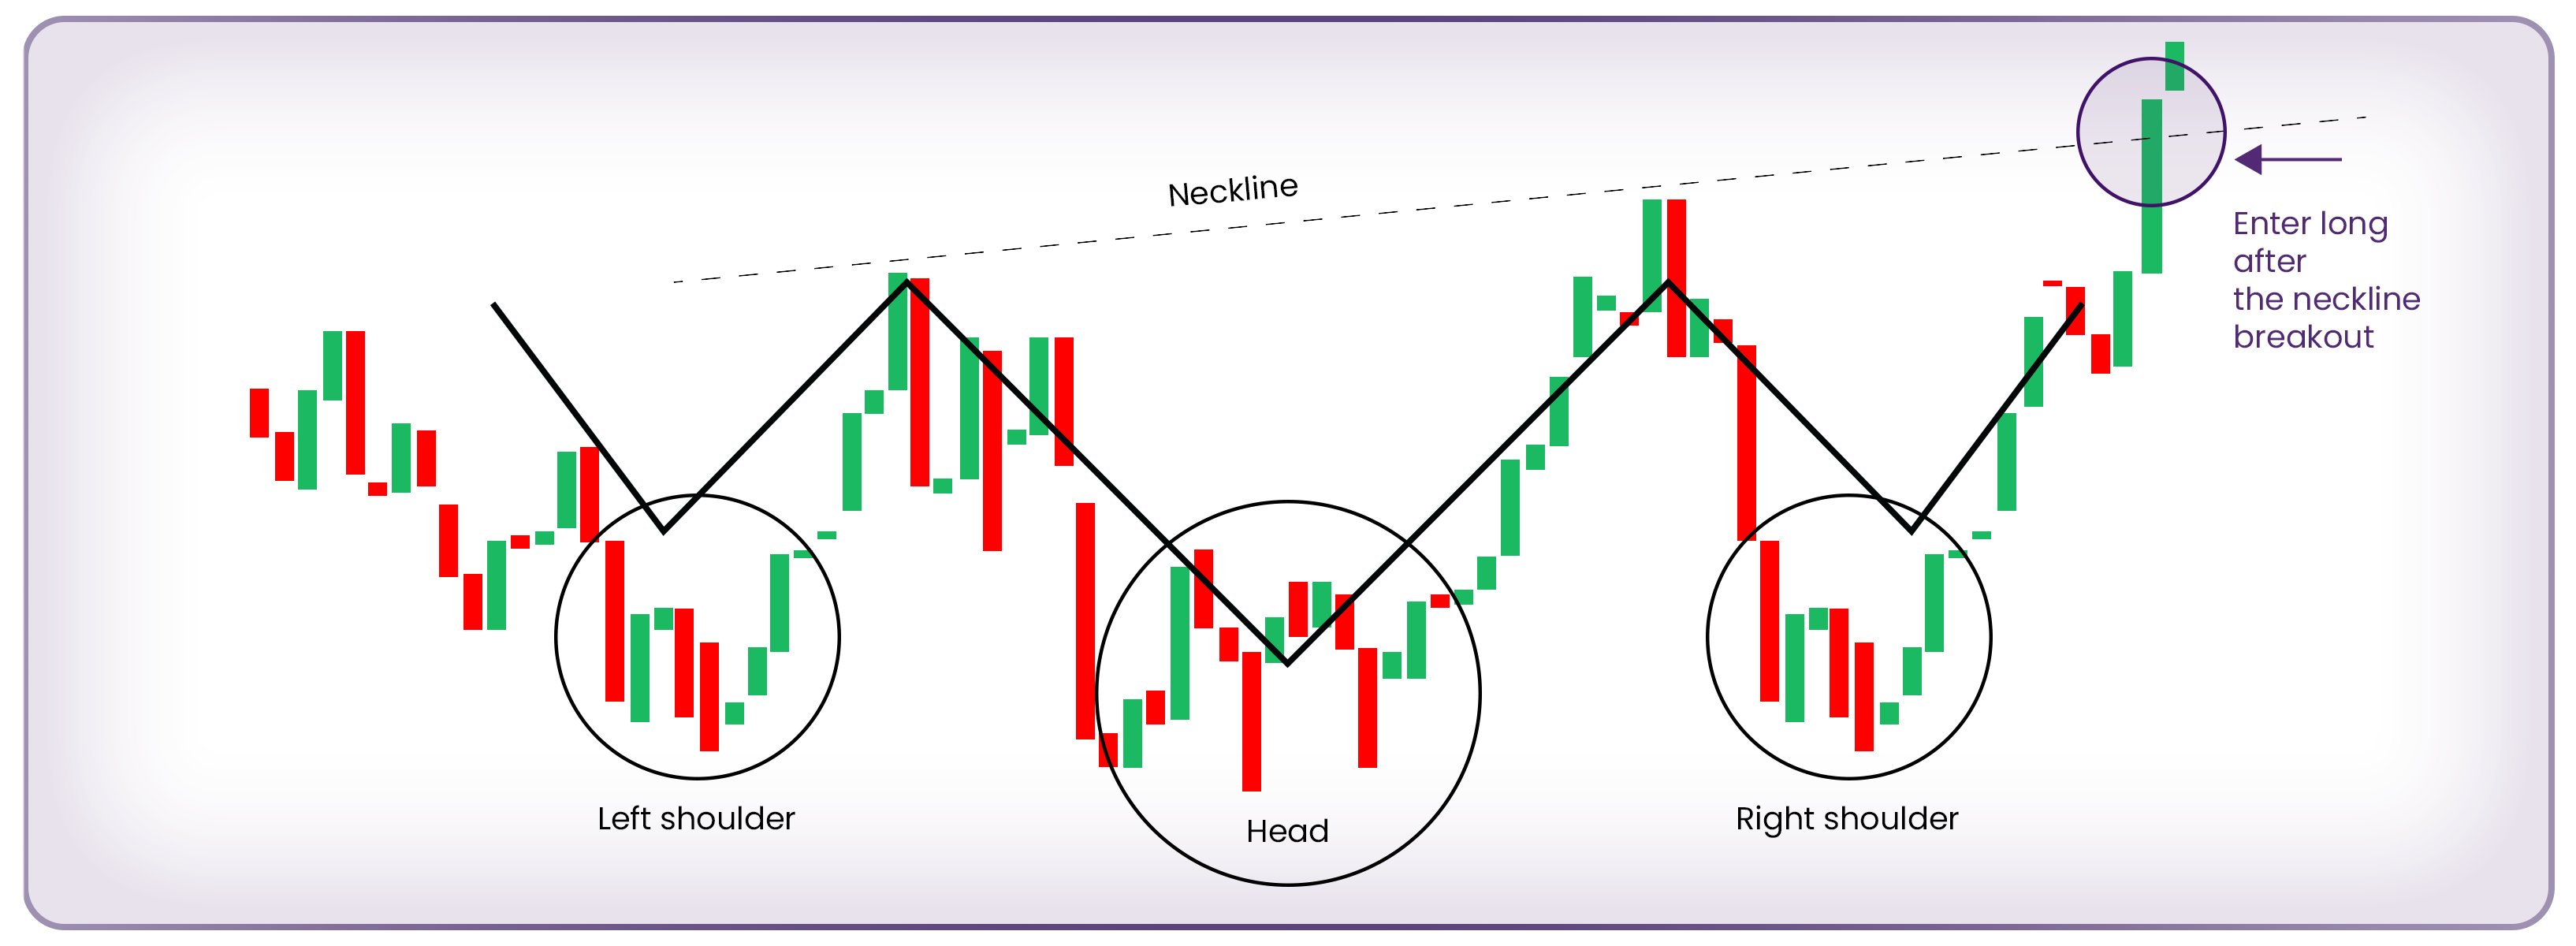
Inverse head and shoulders reversal pattern
This is the bullish reversal counterpart to the head and shoulders. It forms at the end of a downtrend, signaling that the market is ready to reverse upward.
- When to Enter: Wait for the price to break above the neckline before going long.
- Risk Management: Place your stop loss near the bottom of the second shoulder.
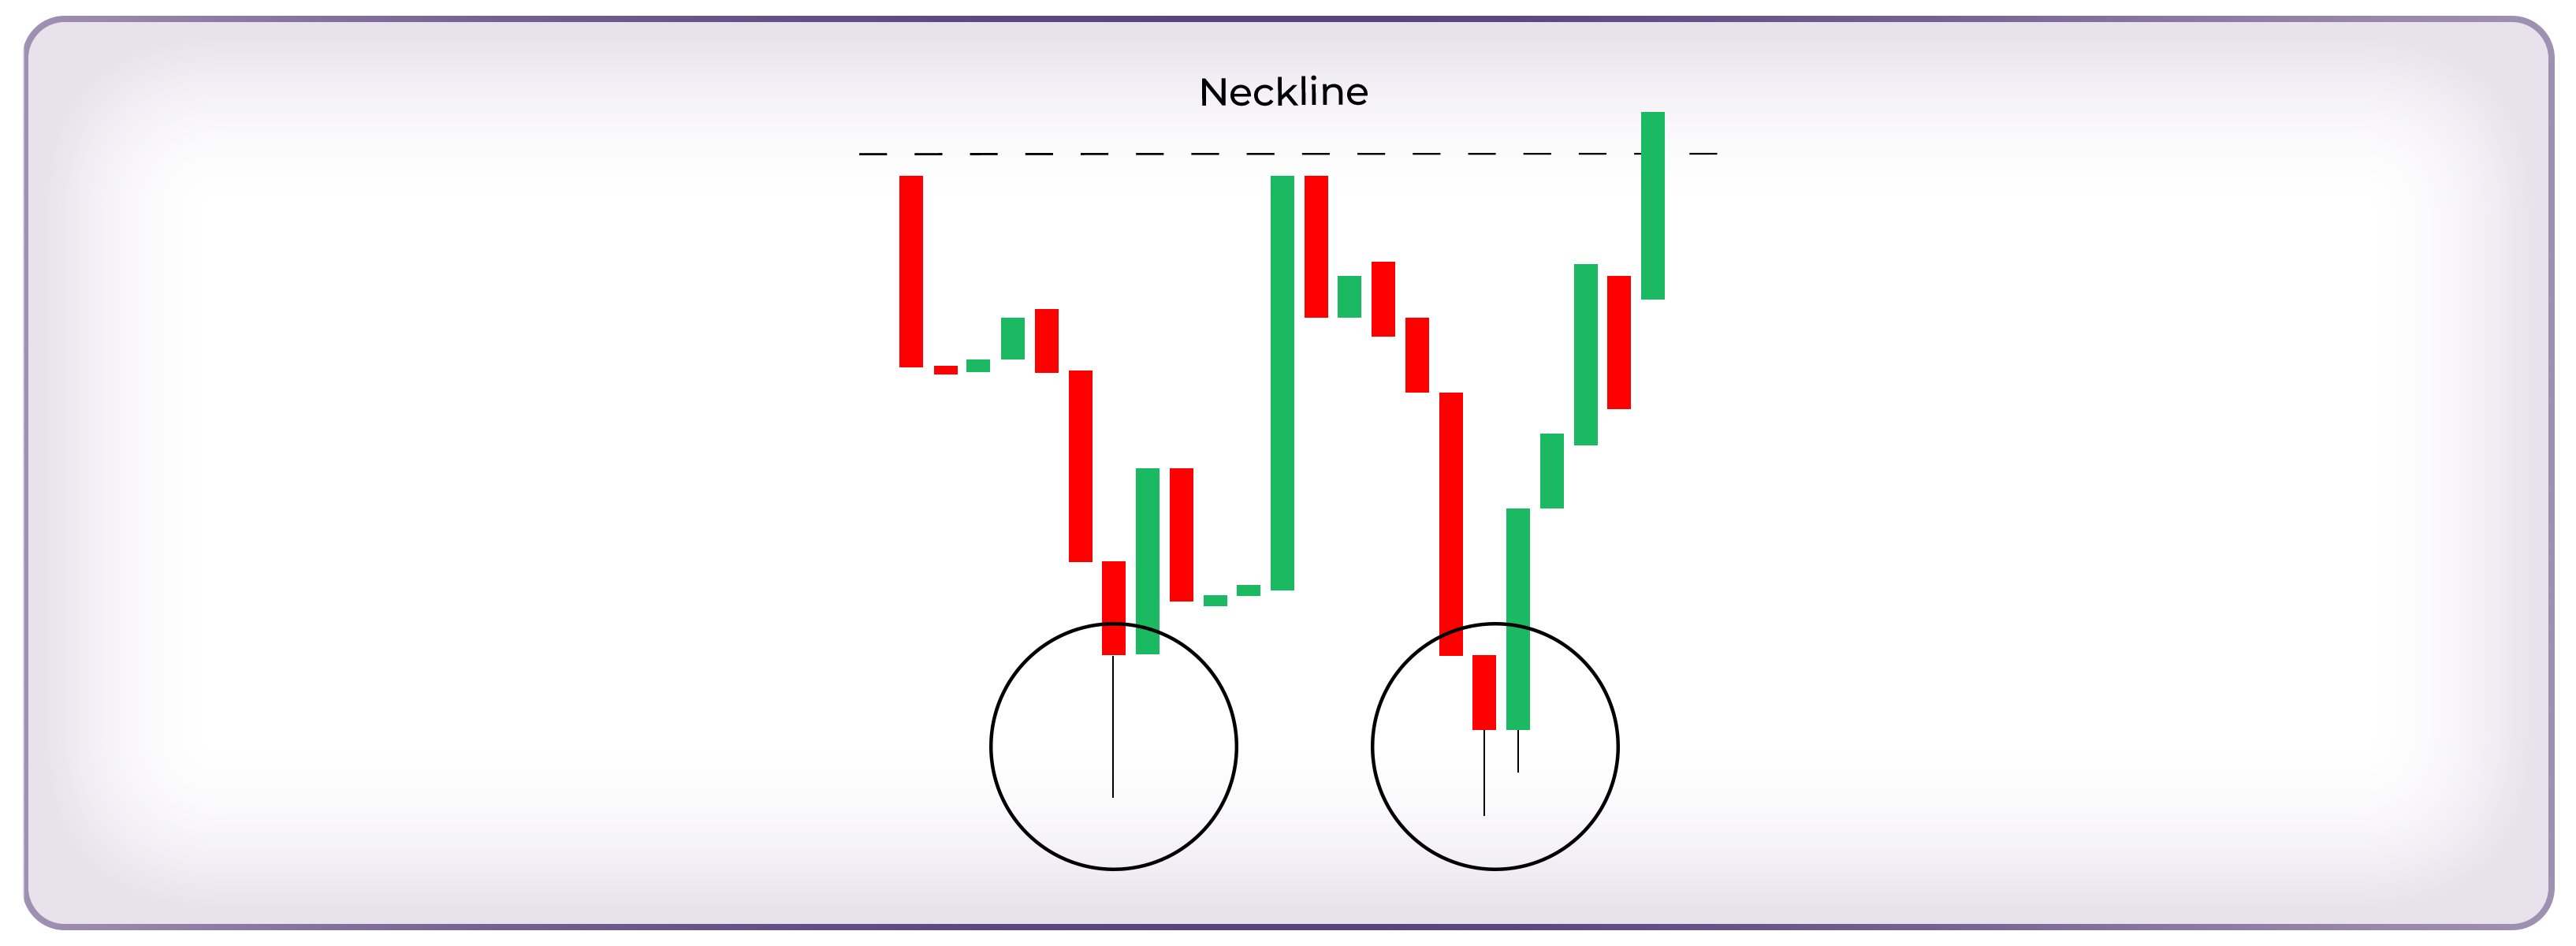
Double bottom reversal pattern
This bullish reversal pattern suggests the price has tested a strong support level twice and bounced back both times. It’s a clear signal that sellers are losing steam, and buyers are stepping in.
- When to Enter: Wait for the neckline to break before entering a long position.
- Risk Management: Place your stop loss just below the lowest bottom.
Avoiding common pitfalls
One of the biggest traps traders fall into is revenge trading after a false breakout or unexpected market move. Remember – not every reversal pattern will work out perfectly. That’s why risk management and patience are your best friends.
Reversal patterns forex traders rely on are powerful tools, but remember – they’re most effective when combined with solid risk management and other technical indicators. Trading reversal patterns with Fintokei means staying sharp, consistent, and in control. So keep an eye on those patterns, manage your risks, and accelerate your trading success!