
Swing strategy for gold trading
Want to trade gold? This swing method is straightforward, effective, and perfect for beginners. By the end of this article, you’ll have the tools and knowledge to start trading gold with confidence.
The biggest challenge many traders face when attempting prop trading challenges is impatience. They rush into trades, make too many of them, and take on excessive risk – all in an effort to complete the challenge as quickly as possible so they can start trading and earning payouts. It’s clear there’s a problem with this approach.
At Fintokei, we’re committed to helping traders accelerate their path to success, starting from the basics. Today, we’re introducing a strategy that will help you identify a clear goal and pursue it methodically, calmly, and efficiently—just like a pro.
We’ll be focusing on higher time frames and trading in a swing style. This approach won’t require much time, yet you’ll still see rewarding results. Plus, we’ll zero in on one of the most profitable instruments – gold. Gold offers no shortage of trading opportunities.
But before we dive in, let’s take a moment to discuss swing trading itself. If you’re already familiar with it, feel free to skip ahead to the strategy.
What is Swing Trading?
Swing trading is a popular trading method that focuses on capturing short to medium-term price movements. It blends the benefits of both technical and fundamental analysis, making it a favored approach among active traders.
In swing trading, positions are typically held overnight, ranging from a few days to a few weeks. This strategy is ideal for those looking to profit from price movements within market trends or corrections without needing to constantly monitor charts. If you prefer not to spend extended hours on your trading platform, the swing trading approach could be perfect for you.
Basic Principles of Swing Trading
- Timeframes and Charts: In swing trading, higher timeframes are key. These allow you to analyze the market using technical analysis and price action. Recently, the Smart Money Concept method has also gained popularity for this purpose.
- Technology in Trading: Technology plays a crucial role in swing trading. When the price reaches a certain level that signals a potential trade, you want to be ready. Utilizing technology, like setting up alerts, can save you time and ensure you don’t miss opportunities. We’ve covered how to trade on your mobile phone and set up notifications on our blog.
- Entering a Trade: The strategy is simple – only enter a trade when the price reaches your predetermined level. Check your charts, confirm the entry signal, and place the trade. Don’t forget to set your stop loss and take profit levels. This way, you can step away from the platform until the trade is complete (if you have the patience!).
Advantages and disadvantages of swing trading
There are two sides to every coin. The same applies to swing trading, which is not just about the pros.
Advantages of Swing Trading
- Time-Saving: Swing trading requires less time compared to intraday trading. You can analyze the market and place your trades in the evening, making it an ideal option if you have a job or are studying.
- Patience and Precision: Swing trading allows you to wait for the right moment to enter a trade, rather than feeling the urge to jump in immediately. This approach lets you capture longer market moves without being confined to the average daily price ranges, a common challenge for intraday traders.
- Managing Multiple Trades: The slower pace of swing trading means you can comfortably manage multiple positions at once. Just be mindful of your drawdown, which is calculated on open positions.
- Lower Psychological Stress: This trading style is calmer and less intense, reducing the likelihood of making impulsive emotional decisions that could result in significant losses.
Disadvantages of Swing Trading
Night and Weekend Risk: Holding positions overnight exposes you to potential risks from events and news that occur outside of trading hours. This can lead to the market opening at an unexpected price, especially after the weekend.
Overnight Swaps: Swaps are fees applied to positions held overnight. Depending on whether your position is long or short and the specific instrument, swaps can either be positive (adding to your profit) or negative (reducing your profit). Some strategies, like carry trading, are specifically designed to take advantage of positive swaps, but for most swing traders, negative swaps are a consideration.
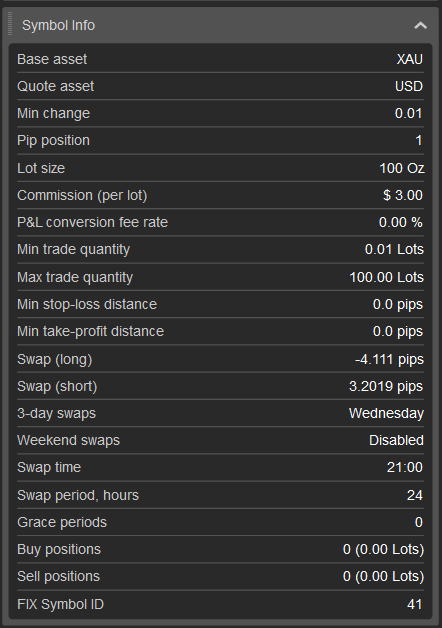
The method of calculating gold swaps can change frequently, so it’s important to check it periodically. You can do this on the cTrader platform by right-clicking on the gold symbol and selecting “Symbols Window.” In this window, you’ll see that negative swaps for gold apply to long positions (swap long), while positive swaps apply to short positions.
- High Demands on Patience: In swing trading, opportunities don’t present themselves every day, so patience is key. It’s important to understand that waiting is part of the strategy—mastering this art is crucial for success.
- Longer Time to Profit: Swing trading on higher time frames often involves wider stop losses and more distant take profit levels compared to intraday trading. If you base your orders on a 4-hour (H4) chart, it may take several days to see a profit (or a loss) materialize.
How to start swing trading?
If you’re new to trading and looking for a strategy to help you profit from the swings in gold without having to constantly watch the charts, you’ve come to the right place! So let’s take a look at how to trade this strategy.
Step 1: Determine the Trend on the Daily Chart
This strategy is centered around trading with the trend, so identifying the trend is your first priority. To do this, start by marking the key swings on the daily chart. Look for patterns of higher highs and higher lows, which indicate an uptrend. Conversely, if you see a series of lower highs and lower lows, the trend is down.
Did you know: Swings are identified by a sequence of at least three candles on the chart?
For a swing high, the high of the middle candle must be higher than the highs of the candles on either side. Conversely, for a swing low, the low of the middle candle must be lower than the lows of the surrounding candles.
While the minimum number of candles required to determine a swing high or low is three, it’s often better to use a higher number of candles to the right and left of the middle candle for a more reliable swing point. The exact number of candles is up to each trader. Using fewer candles will generate more signals, but it also increases the likelihood of false signals.
For example, if you decide to use 10 candles to the right and 10 candles to the left of the middle candle, this means that for a swing high, the high of the 10 candles on either side must be lower than the high of the middle candle, making it a valid swing high. Similarly, for a swing low, the low of the 10 candles on either side must be higher than the low of the middle candle, creating a valid swing low.
Once you’ve identified the swing highs, draw a horizontal line from each of them and mark any false breaks. These false breaks are what we are most interested in.
Step 2: Finding Swings on the H4 Chart
To gain more context and accuracy, we’ll now repeat Step 1 on a lower timeframe, the H4 chart. Switch to the H4 chart and identify the swing highs and lows just as you did on the daily chart. To avoid confusion with the daily swing points, use a different color—like blue, for example—to mark these H4 swings.
Step 3: Market Entry
You’ll want to enter the trade only after liquidity has been taken out. This is indicated by the false break we identified at the swing highs and lows. Essentially, the price will first break that level and then return above the broken swing low or below the broken swing high.
Since it can be difficult to determine if the price is beginning to move in the expected direction after the liquidity is taken or a gap is filled, you can use the Purple Strike indicator for assistance. This trend-following indicator helps you stay in a longer move. A blue signal indicates a bullish trend, while a red signal indicates a bearish trend.
Please note, however, that the Purple Strike indicator is not available on the cTrader platform.
For a Long Signal:
- Identify Swing Points: Determine the swing low and high from the daily and H4 charts.
- Observe Break: Notice if the price breaks below the swing low (support).
- Price Reversal: Watch for the price to return above the broken swing low.
- Purple Strike Confirmation: On the H4 chart, the Purple Strike indicator should turn blue, signaling a long entry.
- Entry Point: Enter the market at the open price of the next candle.
- Stop Loss: Place your stop loss at the low of the candle where the Purple Strike signal occurred.
- Take Profit: Set your take profit at the nearest resistance level identified on the current timeframe.
For a Short Signal:
- Identify Swing Points: Determine the swing high and low from the daily and H4 charts.
- Observe Break: Notice if the price breaks above the swing high.
- Price Reversal: Watch for the price to return below the broken swing high.
- Purple Strike Confirmation: On the H4 chart, the Purple Strike indicator should turn red, signaling a short entry.
- Entry Point: Enter the market at the open price of the next candle.
- Stop Loss: Place your stop loss at the high of the candle where the Purple Strike signal was generated.
- Take Profit: Set your take profit at the nearest support level identified on the current timeframe.
Fintokei tip
If a trade doesn’t offer at least a 1:1 risk-reward ratio when targeting the nearest support or resistance, it’s best to skip that trade and continue searching for a better opportunity.
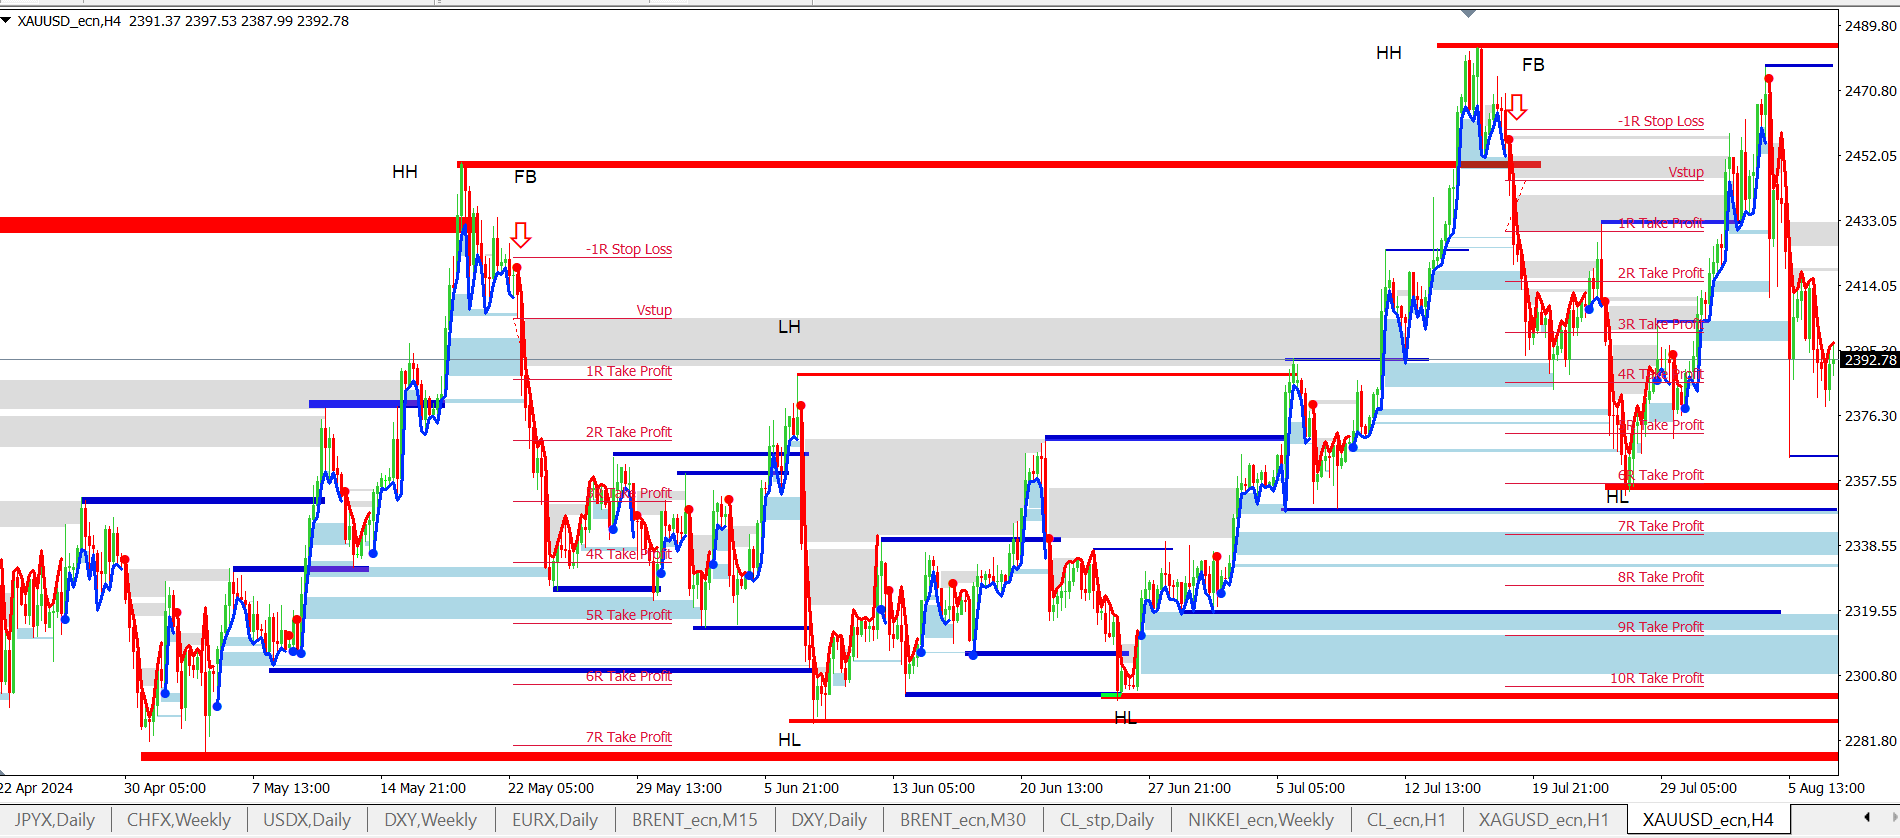
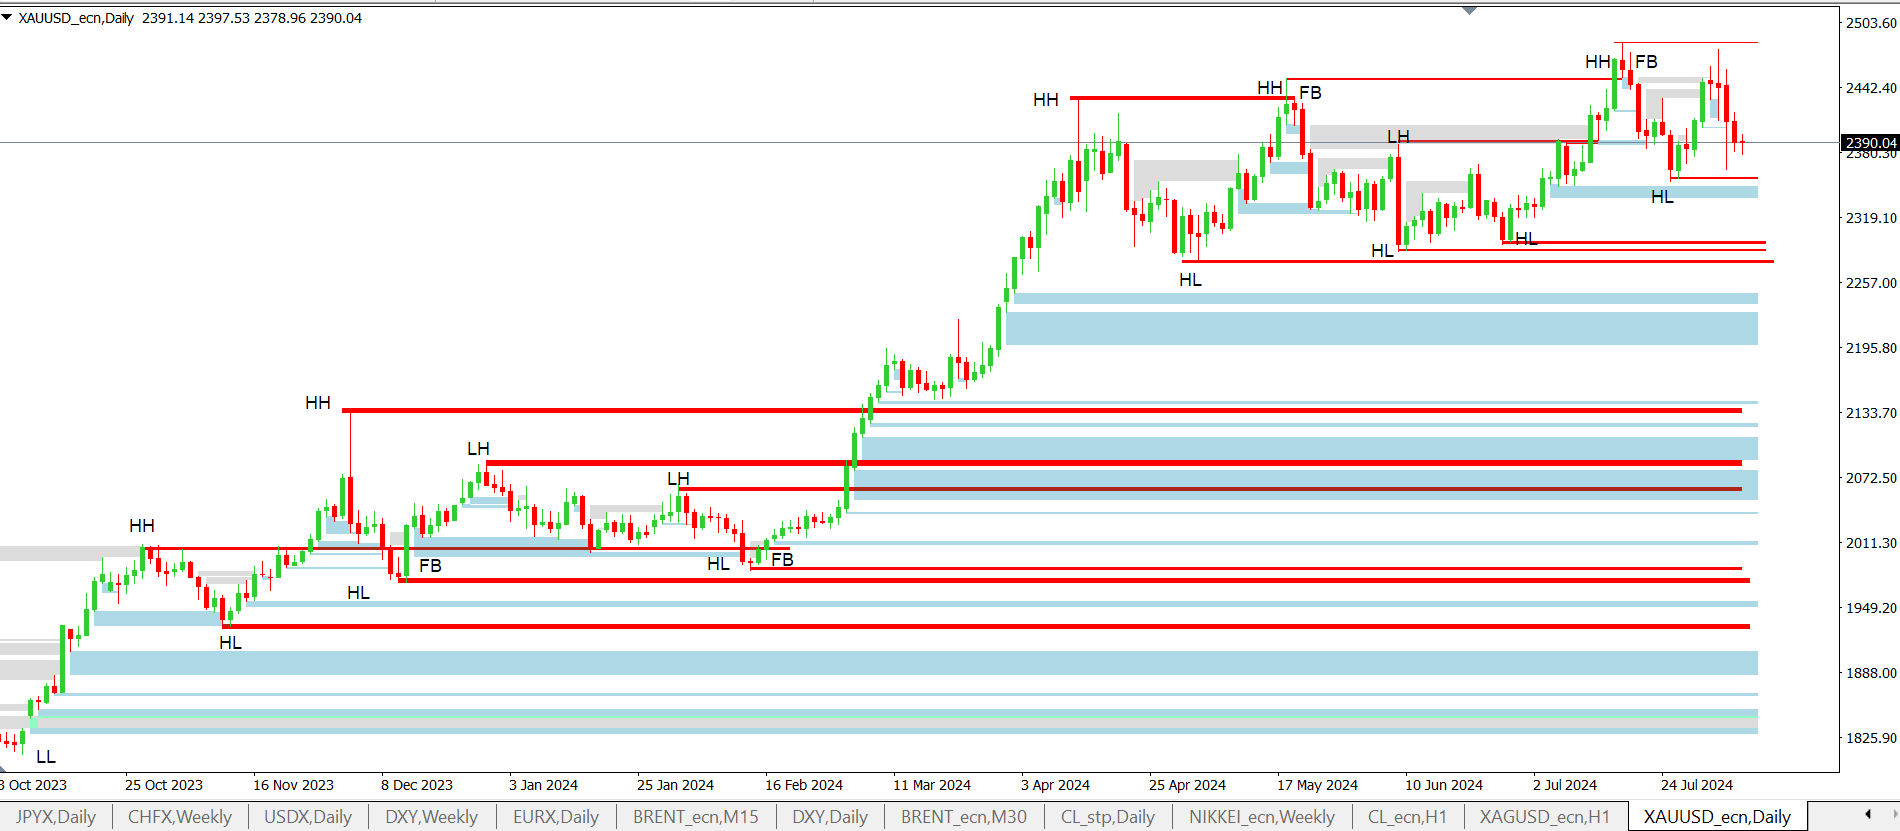
On this chart, you can see the trades that are determined from the daily swing high and swing low
Entering the Market Based on Opportunities from the Daily Chart
In the chart above, we’ve highlighted two trades that emerged after a false break of swing highs identified on the daily chart.
The signal to enter occurs when the Purple Strike indicator on the H4 timeframe changes color—turning blue for long trades and red for short trades. You then enter the trade at the opening of the next candle.
In this case, both signals indicated short trades. The first signal offered a maximum profit potential of 8R, and the second signal offered a potential of 7R, totaling 15R. This means that if we risked 0.5% per trade, it would result in a solid 7.5% profit.
However, the downside is that trades based on swing highs and lows from the daily chart can be infrequent. To increase opportunities, you can also consider entering trades where the swing highs and lows are determined from the H4 chart.
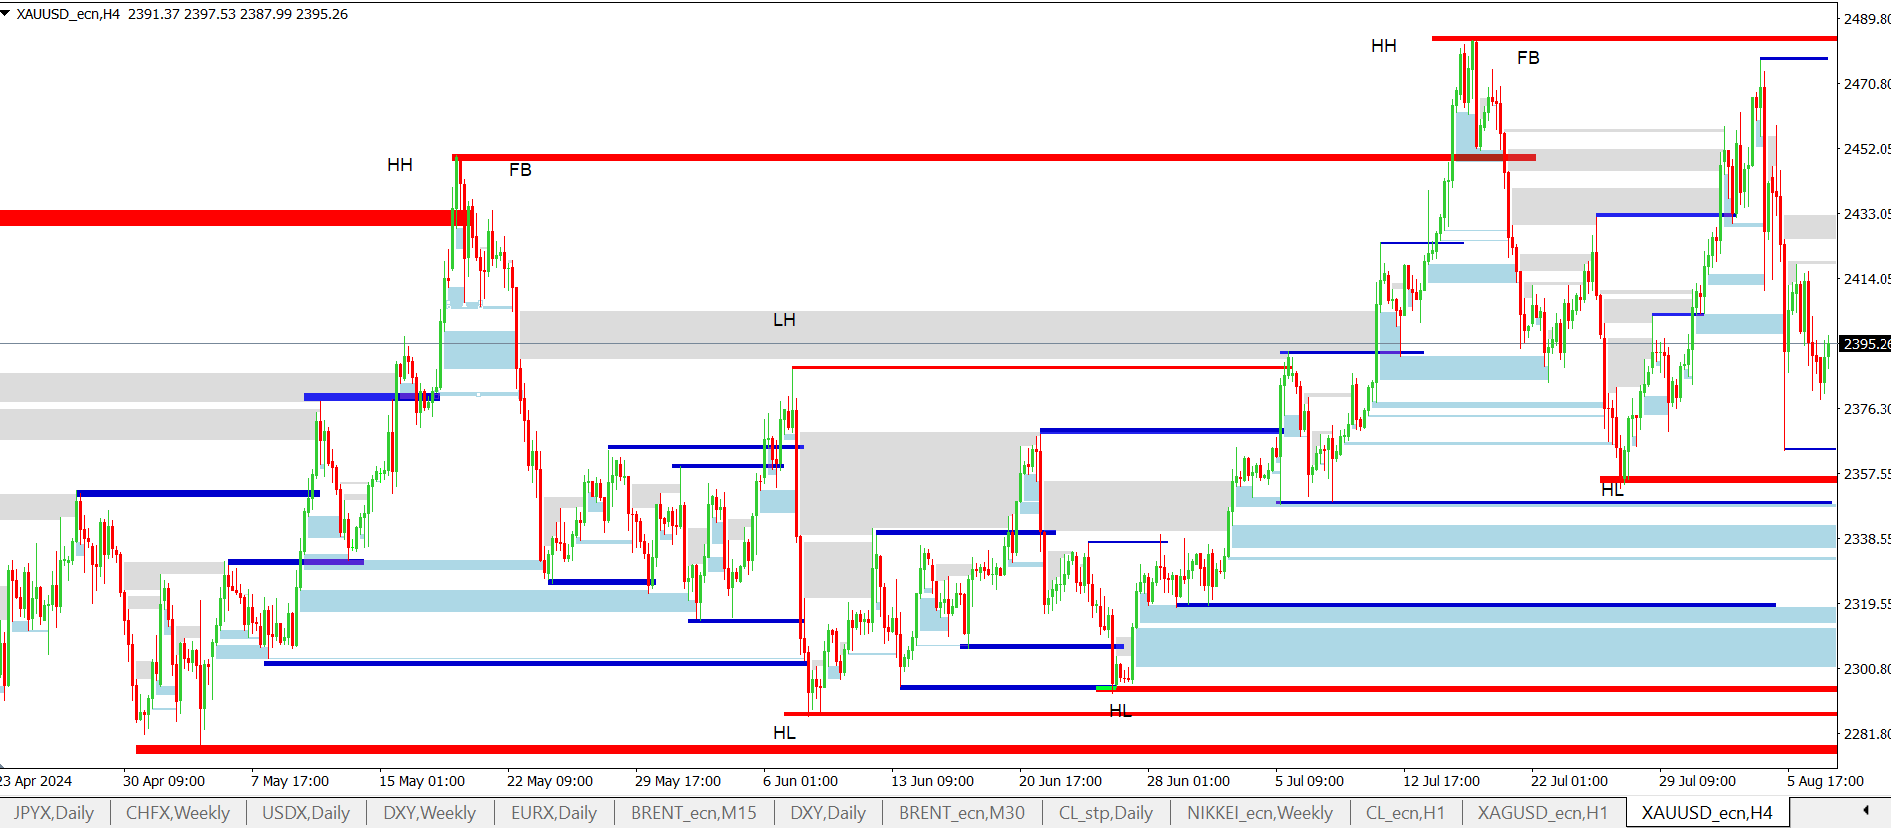
Entering the Market Based on Opportunities from the H4 Chart
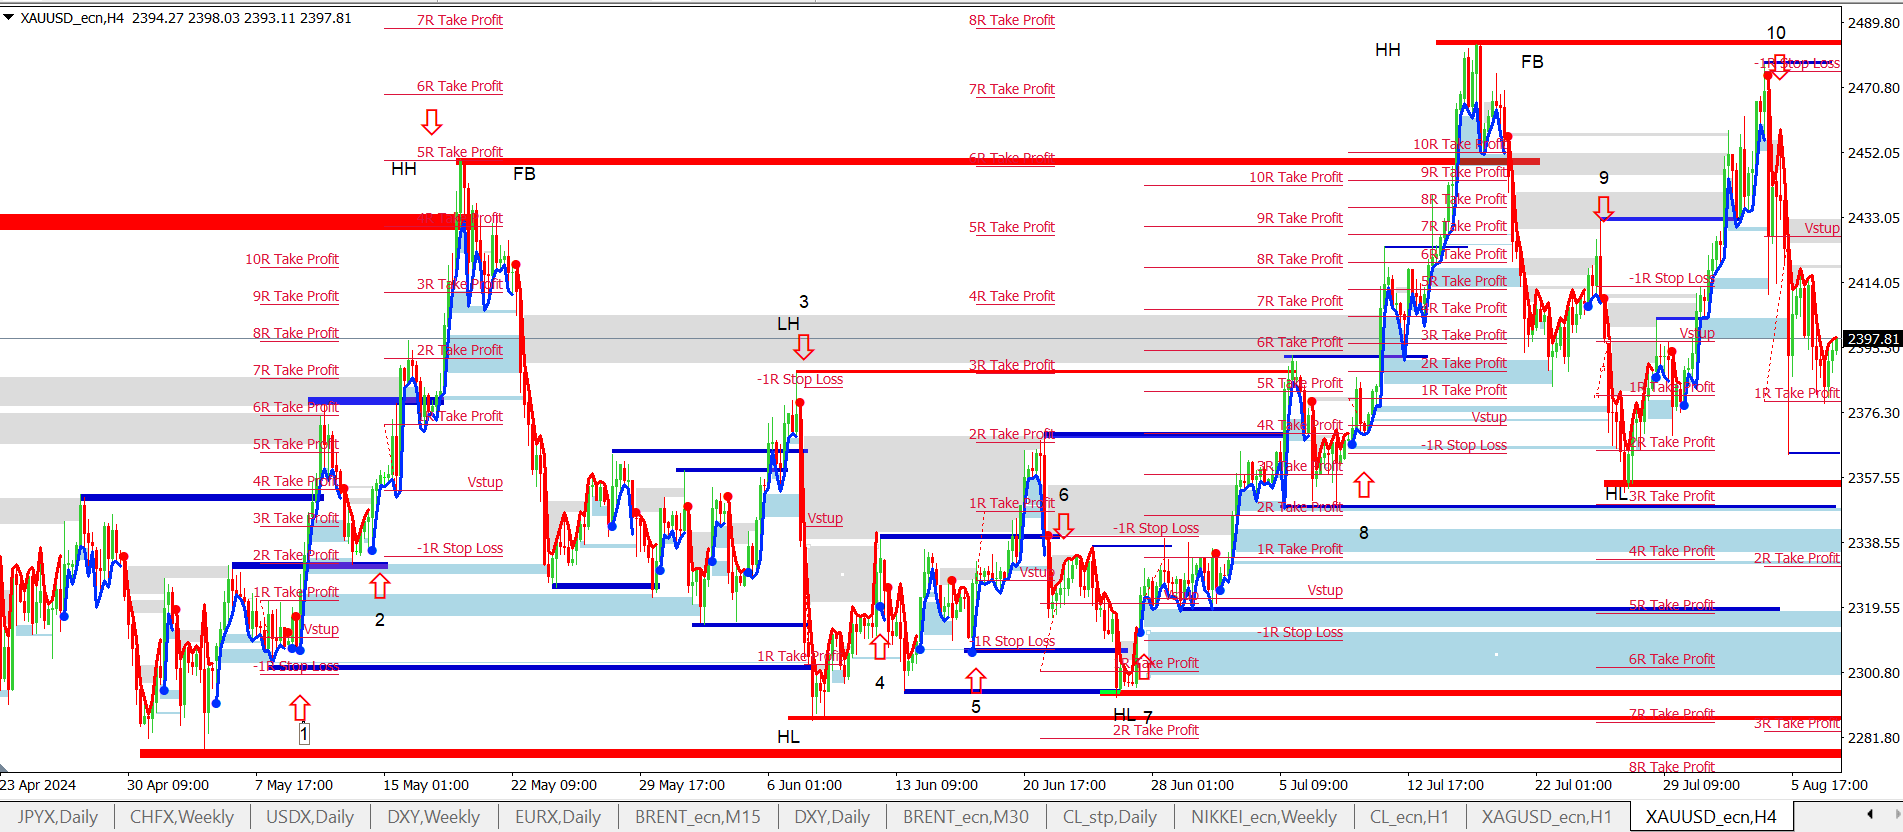
As you can see, after switching to the H4 chart and analyzing it in depth, we get a lot more trading opportunities than on the daily chart. Let’s analyze them one by one.
Trade #1: Here was the breakout of the swing high, the price then came back below the swing high. This confirms the liquidity selection. Enter long after the Purple Strike turns red. Here the trade would not be very profitable, it would give barely R0.5 to the nearest support where we would target the trade. So we would not take the trade.
Trade #2: In this case, the retest of the broken swing high, which was originally resistance, but broke through to become new support. Entry is after the signal turns blue. The gain to the nearest resistance from the H4 chart was 1R. The total potential if we held the trade to the strong swing from the daily chart (red horizontal line) was 4R.
Trade #3: After selecting liquidity at the swing low, it was possible to enter short. However, the potential to the nearest resistance would be barely 1R, so we would not take the trade.
Trade #4: This trade was made after selecting liquidity at the swing low, i.e. at support. It would have given a profit of 1.5R to the nearest resistance. The total potential was 3R.
Trade #5: Long entry after picking liquidity above the swing high. Unfortunately, a long red candle was formed, which does not offer us a very favorable risk/reward ratio on the open entry of the next candle. To the nearest support, the profit would be less than 1R, so we would not take the trade.
Trade #6: Here would be a short, after taking out liquidity at the swing low. While the trade would have a potential of almost 3R to the nearest resistance, it would end up on a stop loss before reaching it.
Trade #7: Here the signal would be long, after collecting liquidity at the previous swing high and returning below that high. To the nearest support, the signal would have given a profit of approximately R0.8, so as expected we have to reject this trade.
Trade 8: After selecting liquidity at the swing low, a long signal was generated, to the nearest resistance the profit would be 1R, to the next strong resistance the profit would be 3R, the maximum potential was 5R.
Trade #9: Here is a short signal after selecting liquidity above the previous swing high. To the nearest support, the profit was less than 1R, therefore we have to reject the trade.
Trade #10: Here is a long after a retest of support. The potential to the nearest resistance was 2.5 R. If we held the trade to the retest of the swing high from the daily chart, then the profit would have been 9.5 R.
Trade #11: A short signal after the price returned below the swing high that was formed on 7/24 at 17:00 and which was broken to the upside on 8/1. Once the price returned below this swing, a short signal was formed. The potential to the nearest support is 1.5 R.
A Few Final Tips
- Balance Technical Analysis with Risk Management: While technical analysis is crucial, it’s just one part of a comprehensive trading strategy. Effective risk management is equally important. Aim to risk no more than 0.5% per trade to protect your capital.
- Be Mindful of Drawdown: Remember, drawdown is calculated on open positions, so choose your trades carefully and take your time. The ProTrader challenge has no time limit, which works in your favor.
- Weigh Profit Potential Against False Signals: Sometimes, you may find opportunities with a better risk-to-reward ratio, but be aware that this often comes with a higher chance of false signals. There’s always a trade-off in trading.
- Keep a Trading Journal: One of the benefits of swing trading is that you have ample time to document and evaluate your trades. Keeping a detailed trading journal will help you refine your strategy over time.
- Practice with a Trial Version: If you’re unsure about meeting the challenge, try your strategy risk-free on a trial version first. StartTrader is also a good option, though it has a 180-day time limit in the evaluation phase, which is usually more than enough.


