What instruments and indices to watch when trading gold?
Want to trade gold like a pro? Don’t ignore the instruments it’s tightly linked with. Understanding how gold’s price moves in relation to these can give you the upper hand in the market.
Want to trade gold like a pro? Don’t ignore the instruments it’s tightly linked with. Understanding how gold’s price moves in relation to these can give you the upper hand in the market. Get the full picture and make smarter trades!
Trading gold offers a slew of benefits that are drawing more and more traders to this lustrous market. Thanks to its high liquidity and volatility, gold trading is ripe with opportunities that can be leveraged with minimal effort and the right approach.
The price of gold is primarily influenced by the US dollar, silver prices, and the HUI index value. This means that savvy gold traders don’t just track gold prices—they keep an eye on these related instruments to fine-tune their analysis. It’s a straightforward and effective strategy to boost your trading outcomes, accessible even to novices. Ready to learn how to spot these opportunities? Let’s dive in and get you set up for success.
What is a correlation?
Correlation in the financial markets is all about how tightly linked the movements of one investment are to another. This connection is quantified by the correlation coefficient, which ranges from -1 to +1. A perfect score of +1 means the assets move in lockstep, always heading in the same direction. On the flip side, a score of -1 indicates they move in completely opposite directions. A zero? That means there’s no relationship at all between their movements. Understanding this can be your secret weapon in predicting how different investments will react to market changes.
How correlation is used in financial markets
Risk Diversification/Hedging: By investing in instruments that have a negative correlation, you can create a safety net for your portfolio. If one asset performs poorly, the other might just offset the losses, thanks to their inverse relationship. This strategic balance is known as hedging, and it’s essential for managing financial risk effectively.
Market Analysis: Identifying correlation patterns between instruments can give you a predictive edge. Understanding these relationships helps forecast market trends, allowing you to position yourself to capitalize on potential movements. Market analysis using correlation is discussed in this article.
Correlation between the dollar, interest rates, and gold
When trading gold, keeping an eye on the US dollar is crucial due to its strong negative correlation—one of the most significant in the markets. It’s often said that as the US dollar moves, gold reacts inversely. Typically, when the dollar weakens, gold strengthens, and vice versa.
However, it’s important to note that this relationship isn’t foolproof. There are instances when gold defies expectations and rises alongside a strengthening dollar, particularly during times of international political tension, such as wars or conflicts.
This unpredictability means while the correlation between the dollar and gold can be a useful indicator, it should not be solely relied upon for trading decisions. Understanding when and why these exceptions occur can greatly enhance your trading strategy.
Example of gold-dollar correlation
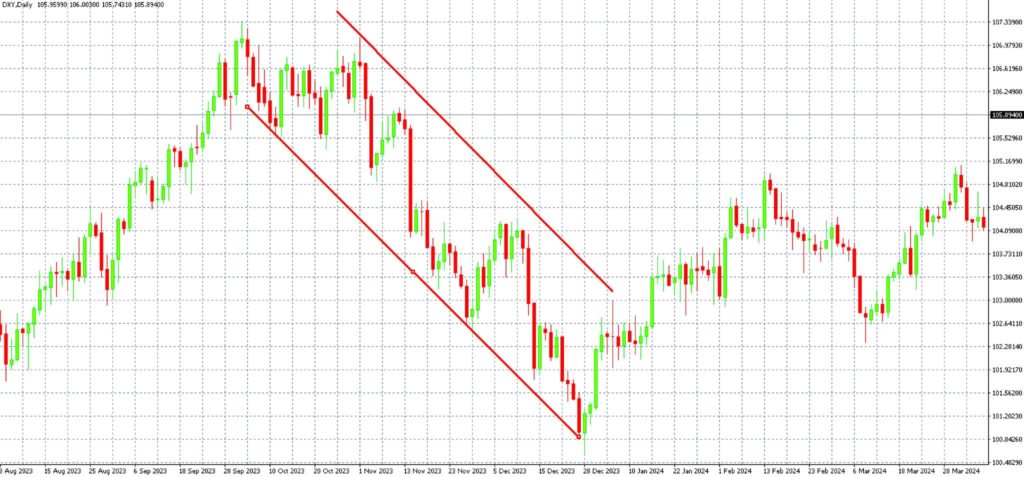
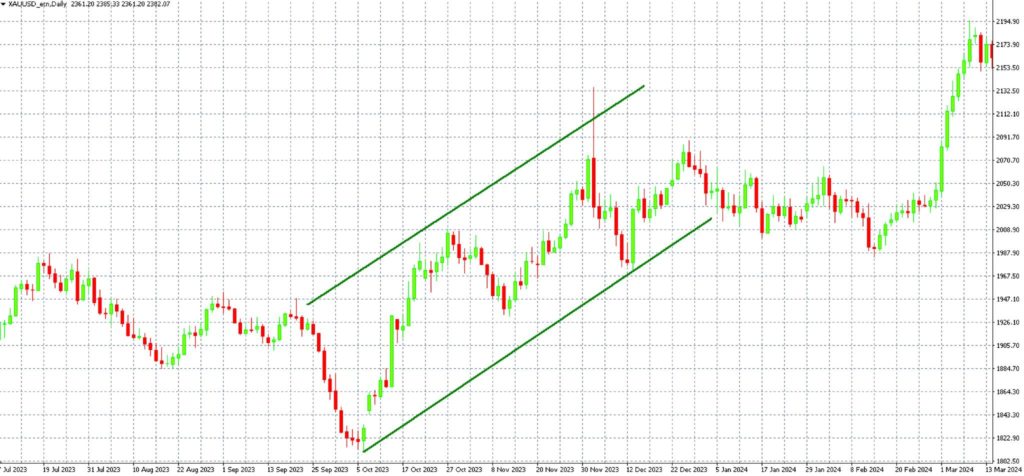
In the charts above, you can observe a significant weakening of the US dollar from September to December 2023, represented using the dollar index on our MT4 platform. This index measures the USD’s strength against several major foreign currencies. Correspondingly, the lower chart illustrates the price of gold during the same period, clearly showcasing their negative correlation.
Let’s delve into the macroeconomic factors behind these trends. The dollar index dropped from 107 to 100 as traders anticipated US interest rate cuts, making the dollar less appealing to foreign investors. Interest rates are a critical element in gold trading, as they directly influence the US dollar’s strength and, consequently, gold prices. Although it’s possible to trade gold without it, some fundamental analysis can certainly enhance your trading strategies.
Regarding gold, the escalation of conflicts in the Middle East in early October pushed its price higher. While it might seem cynical, it’s important to remember that gold often serves as a safe haven during market uncertainty or geopolitical unrest, attracting investors’ money. Following these events, gold primarily capitalized on the weakening dollar, even approaching and occasionally surpassing its record high of over $2,100 per ounce.
If you’re considering leveraging gold’s correlation with the dollar for trading, focusing on longer-term time frames can be particularly beneficial. This approach will help you identify and adapt to broader market trends.
Correlation between silver and gold
The correlation between gold and silver is one of the oldest and most observed relationships in the world of commodities, tracing back hundreds if not thousands of years. It’s even considered the world’s oldest exchange rate. This enduring relationship is quantified by the gold-silver ratio, which compares the prices of these two precious metals.
For example, if an ounce of gold is priced at $2,000 and silver at $20, the ratio is 100. A higher ratio indicates that gold is relatively overvalued, or silver is undervalued. Generally, gold and silver move in tandem, reflecting a positive correlation (coefficient of +1). This makes the gold-silver ratio a fundamental tool for traders who want to analyze market trends and make informed investment decisions.

Gold-silver ration in TradingView platform
The correlation between gold and the HUI index
A key benchmark that tracks the performance of major gold mining companies – demonstrates a strong positive relationship (coefficient of +1). This index, also known as the NYSE ARCA Gold BUGS Index, encompasses stocks from companies deeply involved in gold mining. Generally, when the index rises, indicating an uptick in the value of mining stocks, the price of gold tends to increase as well. This synchronization makes the HUI index a highly regarded indicator within the gold trading community. Its consistent reliability in reflecting changes in the gold market underscores its value to traders who keep a close eye on gold trends.
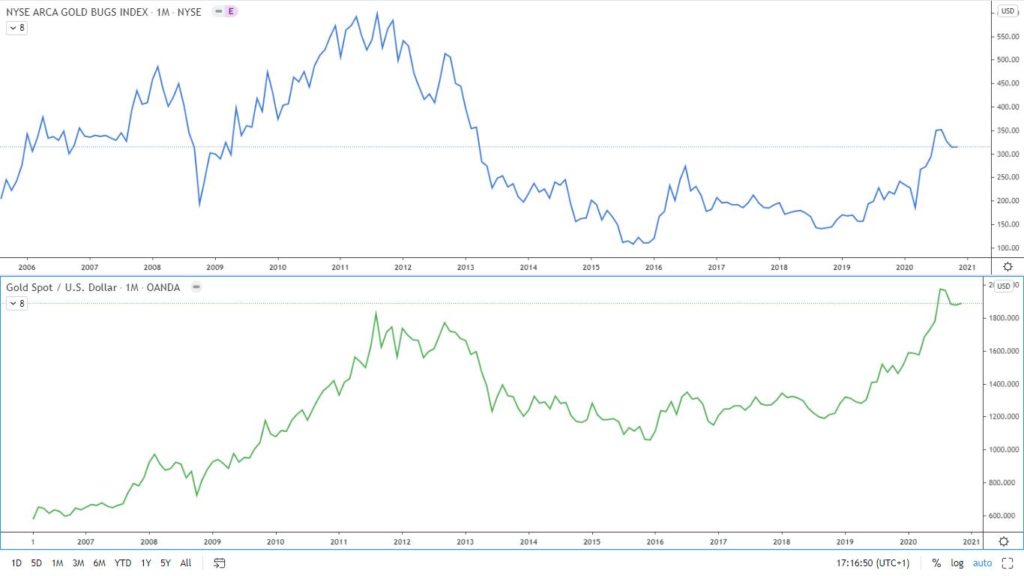
A comparison of the charts above clearly shows a positive correlation between the HUI index and gold. Of course, we are not saying that this index is the only thing you need to trade gold, but in any case, keeping an eye on the HUI index and using it together with the silver and DXY index charts is definitely worthwhile.
Key Takeaways:
-
The U.S. dollar value (tracked by the DXY index), silver, and the HUI index all share significant correlations with gold, offering strategic insights for trading this precious metal.
-
We categorize these correlations as negative (where one instrument’s rise coincides with another’s fall), zero (no observable relationship), or positive (both instruments move in sync).
-
While these correlations aren’t always perfect (100%), they are crucial metrics to monitor. Keeping an eye on these indicators—DXY, silver, and the HUI index—can provide valuable guidance when trading gold, helping you make informed decisions based on broader market movements.

